

The Short Version
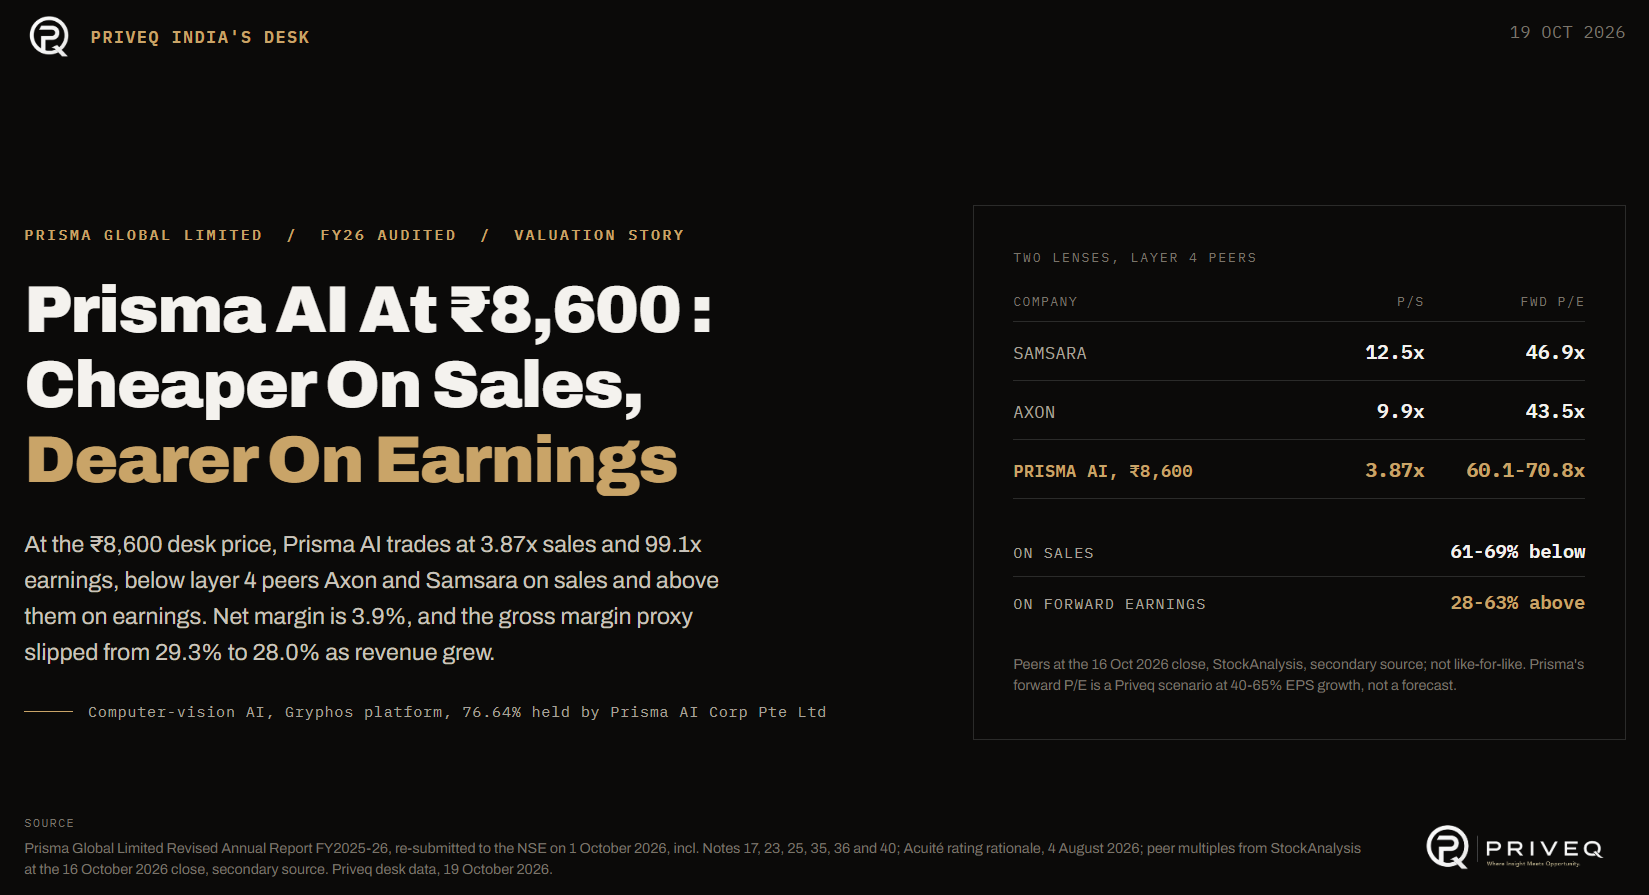
Prisma Global Limited (Prisma AI), a computer-vision AI company, reported standalone FY26 revenue of Rs 1,117.08 crore, up 64.7%, and profit after tax of Rs 43.31 crore in an annual report re-submitted to the NSE on October 1, 2026. Prisma AI's growth sits on Rs 307.71 crore of borrowings, half of it owed to insiders and repayable on demand, while current liabilities exceed current assets and net debt stands at 2.29 times equity (March 31, 2026). Insiders here means two key managerial personnel, Maryann and Shreeram Iyer, and Maas AI Private Limited, an entity in which the filing says directors exercise control. Our read at the Priveq desk price of Rs 8,600 (as of October 17, 2026): Prisma AI trades at about 3.87x sales and 99.1x earnings, below layer 4 AI peers on sales and above them on earnings, so the price needs net margin to rise from 3.9% toward 8% or earnings to compound near 40% a year; gross margin is the variable that would change this read.
Company: Prisma Global Limited (common name : Prisma AI)
Sector: Computer-vision AI software and services, layer 4 of the AI stack with layer 5 cost traits (Priveq category: Technology Cloud & AI)
Latest audited year : FY2025-26, year ended March 31, 2026 (revised report re-submitted October 1, 2026)
Key figures, standalone (Rs crore) : Revenue 1,117.08; profit after tax 43.31; total equity 118.89; net debt 272.49; net debt to equity 2.29x
Key figures, consolidated (Rs crore): revenue 1,119.09; profit after tax 43.63; EPS Rs 86.76
Desk price: Rs 8,600 per share as of October 19, 2026 (indicative; reflects unlisted market activity, not an independent Priveq valuation); minimum lot 100 shares
Valuation lens (derived by Priveq at the desk price): price to sales 3.87x; EV/EBITDA 37.0x; price to earnings 99.1x as a cross-check
Primary sources: Prisma Global Limited Revised Annual Report FY2025-26; cover letter dated October 1, 2026; Acuité rating rationale dated August 4, 2026
Identifiers: CIN U72900MH2013PLC240611 and equity ISIN INE0B2O01014, both as shown on the Priveq Marketplace page for Prisma Global Limited (the CIN also matches third-party MCA-derived listings); not yet checked against an MCA master-data pull. The cover letter cites a different ISIN, INE0B2O07011, with NSE symbol 10PGL28 in a Regulation 53 letter, which we read as a debt security and do not use here.
Last verified: October 18, 2026
For the live desk snapshot, see Prisma Global on the Priveq Marketplace.
What The FY26 Annual Report Says
Prisma Global Limited filed a revised annual report for FY2025-26 on October 1, 2026, replacing the version first submitted on September 3, 2026, and reports standalone revenue of Rs 1,117.08 crore for the year ended March 31, 2026 (Directors' Report, page 55). The cover letter says pages 27, 67 and 114 contained a clerical mistake and that nothing else changed. It does not say what was corrected, and we did not identify the change by comparing the two versions. Page 114 is the shareholding page, so we flag it wherever we use it.
On the filed numbers, standalone revenue rose from Rs 678.23 crore to Rs 1,117.08 crore, a rise of 64.7%, and standalone profit after tax rose 72.7% to Rs 43.31 crore. The company reports consolidated revenue of Rs 1,119.09 crore, up 63.5%, and a consolidated operating EBITDA margin of 11.67%. Standalone and consolidated figures are close because the subsidiary, Snap2Life Global Private Limited, is small. We use consolidated figures for the valuation multiples and standalone figures for leverage, because we read the standalone balance sheet in full and not the consolidated one.
The FY25 comparatives are restated because FY26 is Prisma's first year under Ind AS. The 64.7% is therefore growth over the restated base, not over the profit originally reported. We cover the restatement below.
Prisma Global FY26 vs FY25: Standalone And Consolidated Results, Rs Crore
(Rs. in Crore) | FY26 standalone | FY25 standalone | FY26 consolidated | FY25 consolidated |
|---|---|---|---|---|
Revenue from operations | 1,117.08 | 678.23 | 1,119.09 | not read |
Total income | 1,121.77 | 682.62 | 1,123.67 | 688.66 |
Profit before tax | 83.04 | 38.31 | 83.63 | 38.72 |
Current tax | 26.43 | 10.00 | 26.80 | 10.63 |
Deferred tax | 13.30 | 3.24 | 13.20 | 3.27 |
Profit after tax | 43.31 | 25.07 | 43.63 | 24.82 |
EPS (Rs) | 86.10 | 49.85 | 86.76 | 49.36 |
Source: Prisma Global Limited, Revised Annual Report FY2025-26, Directors' Report (page 55) and Note 23 (page 118); consolidated revenue from Key Financial Achievements (page 7). Converted from Rs lakh by Priveq. FY25 consolidated revenue from operations was not read for this note; the company states consolidated revenue growth of 63.5%.
Product And Revenue Segmentation
Prisma Global Limited reports one revenue line, "Sale of services", of Rs 1,117.08 crore for FY26 against Rs 678.23 crore for FY25, all recognised over time, with no split by product, customer, industry or geography (Note 23, page 118).
Prisma AI sells computer vision: software that reads what cameras see. The annual report describes it this way (pages 8 and 11 to 14):
Gryphos platform: a patented Cognitive Visual AI platform with more than 300 APIs and pre-trained engines for face, object, text (OCR), image and video analysis, deployed on-premises or on a private cloud.
Existing camera networks: the platform works on camera networks a customer already owns, so a buyer is not asked to replace hardware.
Four application areas: safety, security, mobility and operational intelligence.
Four named products: GryFAS, GrySEC, GryVIDS and GryScan.
Routes to market: sales partners, vendor and implementation partners, and technology partners.
Footprint: four global offices and 19 partner offices across Singapore, India and the UK.
Origins: founded in 1981 in Germany by former IBM professionals (milestones, page 8).
Our read, not a company statement: working on existing cameras matters commercially. The sale is a software and integration project on infrastructure already in place, which helps adoption speed and also means a large share of project value can be delivery work, as the cost lines below show.
The filing does not tell us where the growth comes from. Any statement about which product, customer or region drove the 64.7% would be a guess, so we make none.
Net read: Prisma AI has a credible product and a distribution model built on partners, but the revenue disclosure is too thin to say what is driving growth or how repeatable it is.
Where Prisma AI Sits In The AI Stack
Prisma AI sells at layer 4 of a five-layer AI stack and spends like layer 5, with operating expenses at 72.0% of FY26 standalone revenue (Note 25, page 120; layer map by Priveq). The AI trade is not one bet: the market prices chips, data centres, power and cooling, cloud platforms, applications and services differently, because each layer earns money in a different way. The five layers below are Priveq's working map, not an industry standard.
The AI Stack : Where Each Layer Sits And What Tends To Drive Its Multiple
Layer | What it is | What tends to drive the multiple (Priveq read) | Prisma AI exposure |
|---|---|---|---|
1. Compute | Chips and AI servers | Scarcity and the capex cycle | None: Prisma does not make hardware |
2. Power, cooling, data centres | Physical capacity for AI | Build-out pace and capacity demand | None: Prisma buys infrastructure services (Note 25) |
3. Cloud and models | Platforms that host and serve AI | Usage scale and platform lock-in | Indirect: Prisma deploys on customers' cloud or on-premises setups |
4. Applications | Software that solves one industry problem with AI | Contract durability, renewals, margin expansion | Core: Gryphos and the Gry-series products |
5. AI-enabled services | Integrators and delivery firms | Utilisation and pricing; currently de-rated | Material: operating expenses are 72% of revenue and employee cost is 0.2% (Notes 25-26) |
Layer definitions and the 'what drives the multiple' column are Priveq's read of how the market tends to price each layer; they are not company disclosures. Prisma AI exposure is read from the Revised Annual Report FY2025-26 (pages 11-13) and Note 25 (page 120).
Prisma AI belongs to layer 4 by what it sells : a vertical application of AI sold to organisations that want to act on video. Its cost base looks more like layer 5. The filing shows no chip manufacturing or data-centre operation, and Note 25 shows operating expenses spent on integration support, infrastructure and consulting, project consultants and software customisation. A layer 4 multiple assumes software-like margins and a layer 5 multiple assumes services-like ones. Prisma AI sells like layer 4 and costs like layer 5 today. Whether it moves toward the first is the central question.
For scale on the infrastructure side, Netweb Technologies, a listed Indian AI-server maker at layers 1 to 2, trades at 10.0x sales, 103.1x trailing earnings and 65.9x forward earnings (as of October 16, 2026) on a 9.7% net margin and a 47.42% three-year consensus revenue growth forecast. The market pays a high multiple for visible hardware growth with a high margin, and Prisma AI has the growth without the margin.
Net read : Layer 4 names get software multiples when they show software margins. Prisma AI's 28.0% gross margin proxy keeps it between the two layers for now.
Corporate History And Capital Structure
Prisma AI Corporation Pte Ltd held 76.64% of Prisma Global Limited at March 31, 2026, down from 82.20% a year earlier (Notes 15.3 and 15.4, page 114, a page the company corrected on October 1, 2026).
Origins: the group was founded in 1981 in Germany (milestones, page 8). We did not read the incorporation history of the Indian entity in the pages we reviewed.
Share capital: 50,29,561 equity shares of Rs 10 each; authorised capital increased to Rs 30 crore (Directors' Report item 5, page 56).
Holding company: Prisma AI Corporation Pte Ltd held 38,54,500 shares at March 31, 2026 against 41,34,500 a year earlier. The company's printed change is (5.75)%; the percentage point fall from the filed holdings is 5.56 (derived).
Other holders named: Amitabh Roy Chowdhury 4.42% (6.59% a year earlier); Shreeram Subramaniam Iyer 1.95% (1.29%). The filing does not say who acquired the shares the holding company and Mr Roy Chowdhury reduced.
Proposed ESOP 2026: to be placed before members; its size is not modelled in this note and would add to the share count (Directors' Report item 5, page 56).
Security and guarantees: the Investec external commercial borrowing is secured by hypothecation and a pledge of securities provided by the Guarantor and Promoters; Union Bank term loans are secured by residential properties owned by directors (Note 17.1, page 116).
Not read: private placement or preferential allotment prices, promoter share transfers and the incorporation history of the Indian entity. The filings we read give no per-share price ladder, so we do not show one.
Net read: Ownership is concentrated in the holding company, and the directors' personal assets and promoters' pledged securities sit behind the bank debt. The shareholding page is one the company corrected, so we hold the percentages as filed and do not build on them.
What The Cost Lines Say About The Business Model
Prisma Global Limited's operating expenses were 72.0% of standalone revenue in FY26 against 70.7% in FY25 (Note 25, page 120).
Prisma Global Standalone Cost Structure, FY26 vs FY25, Rs Crore
Rs crore | FY26 | FY25 | FY26 % of revenue |
|---|---|---|---|
Revenue from operations (Note 23) | 1,117.08 | 678.23 | 100.0% |
Operating expenses (Note 25) | 804.60 | 479.81 | 72.0% |
Front-end integration support services | 249.80 | 155.16 | 22.4% |
Infrastructure, consulting and support services | 241.21 | 134.29 | 21.6% |
Project consultants | 168.85 | 87.31 | 15.1% |
Software customization expenses | 144.74 | 103.06 | 13.0% |
Gross margin proxy (derived: 1 less operating expenses / revenue) | 28.0% | 29.3% | |
Marketing expenses (Note 29) | 159.31 | 115.91 | 14.3% |
Other expenses, total (Note 29) | 185.58 | 123.58 | 16.6% |
Employee benefits expense (Note 26) | 2.59 | 16.92 | 0.2% |
Operating EBITDA, before other income (derived) | 124.32 | 57.92 | 11.1% |
Finance costs (Note 27) | 31.12 | 14.27 | 2.8% |
of which interest on shortfall in advance income-tax | 11.22 | 3.98 | 1.0% |
Depreciation and amortisation (Note 28) | 14.84 | 9.74 | 1.3% |
Effective tax rate (derived: current + deferred tax / PBT) | 47.8% | 34.6% |
Source: Prisma Global Limited, Notes 23 and 25-29 to the Standalone Financial Statements (pages 118-121 of the Revised Annual Report FY2025-26). Prisma does not report a gross margin; the proxy treats Note 25 operating expenses as cost of delivery. Operating EBITDA is revenue less operating, employee and other expenses, derived by Priveq; it ties to the filed EBIT (PBT plus finance cost) once other income of Rs 4.68 crore and depreciation are added back and deducted. The company states a consolidated operating EBITDA margin of 11.67% (page 7).
Prisma does not report a gross margin. If we treat the Note 25 operating expenses as the cost of delivery, the proxy is 28.0% in FY26 against 29.3% in FY25, so the mix did not improve while revenue grew 64.7%. That is a Priveq derivation, and a 28% proxy sits closer to a services business than to the software margins layer 4 companies are usually valued on. We have no peer gross margin figure from a primary source, so we make that comparison as a read and not as a sourced fact.
Three other lines stand out. Marketing expense is Rs 159.31 crore, 14.3% of revenue, up from Rs 115.91 crore. Employee benefits expense fell from Rs 16.92 crore to Rs 2.59 crore even as revenue rose 64.7%; the pages we read give no reason, and the pattern fits delivery through consultants and outsourced lines, but that is an inference. Operating EBITDA before other income is Rs 124.32 crore, 11.1% of revenue, derived from the filed lines, close to the company's stated consolidated margin of 11.67%.
Net read: Margin did not widen as revenue grew 64.7%; the extra revenue came with proportionally extra delivery cost and heavier marketing.
How The Growth Is Funded
Prisma Global Limited's standalone gross borrowings were Rs 307.71 crore at March 31, 2026 against Rs 199.76 crore a year earlier (Note 17, page 115; gross total derived by Priveq).
Prisma Global Standalone Leverage And Liquidity
Rs crore unless stated | Mar 31, 2026 | Mar 31, 2025 | Apr 1, 2024 |
|---|---|---|---|
Long-term borrowings | 73.75 | 104.80 | 1.98 |
Short-term borrowings (incl. current maturities) | 233.96 | 94.96 | 13.48 |
Gross borrowings (derived) | 307.71 | 199.76 | 15.45 |
Cash and cash equivalents | 35.22 | 7.18 | 7.37 |
Net debt (company table) | 272.49 | 192.58 | 8.09 |
Total equity | 118.89 | 65.54 | 37.51 |
Net debt to equity (company table, times) | 2.29 | 2.94 | 0.22 |
Current assets | 507.63 | 384.44 | not read |
Current liabilities | 567.85 | 392.51 | not read |
Net working capital | (60.21) | (8.07) | not read |
Current ratio (derived, times) | 0.89 | 0.98 | not read |
Debt service coverage ratio (company, times) | 1.18 | 1.01 | not read |
Interest cover, EBIT / finance cost (derived, times) | 3.67 | 3.68 | not read |
Source: Prisma Global Limited, Note 17 (page 115), Note 36.1 capital table (page 129) and the ratio disclosures on pages 134-135 of the Revised Annual Report FY2025-26. Gross borrowings, current ratio and interest cover are derived by Priveq. Net debt and net debt to equity are the company's own table.
Gross standalone borrowings rose from Rs 15.45 crore on April 1, 2024 to Rs 199.76 crore at March 31, 2025 and Rs 307.71 crore at March 31, 2026. The company's own capital table shows net debt of Rs 272.49 crore against equity of Rs 118.89 crore, or 2.29 times, down from 2.94 times a year earlier but far above 0.22 times at the start of FY25. Of the total, Rs 233.96 crore is classed as short-term, and current liabilities of Rs 567.85 crore exceed current assets of Rs 507.63 crore, a net working capital deficit of Rs 60.21 crore and a current ratio of 0.89.
The largest named bank-type facility is an external commercial borrowing from Investec Bank PLC at SOFR plus 5%, stated purpose research and development, repaid quarterly, with Rs 101.03 crore outstanding (Rs 70.72 crore non-current and Rs 30.31 crore current). It is secured by hypothecation and by a pledge of securities provided by the Guarantor and Promoters. Union Bank term loans are secured by residential properties owned by directors. Other borrowings include a vehicle loan at 9.99% and a business loan at 14.95%. Note 36 states there was no default or covenant breach.
Finance costs rose to Rs 31.12 crore, of which Rs 11.22 crore is interest on the shortfall in advance income-tax. Interest cover, EBIT over finance cost, is 3.67 times, flat on last year, and the company's debt service coverage ratio is 1.18. The effective tax rate was 47.8% against 34.6% in FY25. We did not read the tax reconciliation, so we cannot say what drove it. For scale only: at FY25's 34.6% rate, standalone FY26 profit would have been about Rs 54.4 crore instead of Rs 43.3 crore. That is a Priveq derivation to show how much the tax line moves earnings, not an estimate of what profit should have been.
Net read: Leverage fell from last year's peak but is still more than ten times where it started FY25, and a current ratio of 0.89 means the company relies on rolling or refinancing short-dated debt.
The Insider Loans And Related-Party Flows
Rs 153.08 crore of Prisma Global Limited's borrowings at March 31, 2026 is owed to related parties, all payable on demand (Notes 17 and 17.1, pages 115 to 116).
Prisma Global Loans From Related Parties, Standalone, Rs Crore
Lender | Relationship (Note 35) | Mar 31, 2026 | Mar 31, 2025 | Rate and terms (Note 17.1) | Taken in FY26 | Repaid in FY26 |
|---|---|---|---|---|---|---|
Maryann Shreeram Iyer | Key management personnel | 47.89 | 42.23 | 1% per month, payable on demand | 13.94 | 8.28 |
Shreeram Subramaniam Iyer | Key management personnel | 3.88 | 2.74 | Interest free, payable on demand | 22.95 | 21.84 |
Maas AI Private Limited | Entity in which directors exercise control | 101.31 | nil | 1% per month, payable on demand | 103.43 | 2.12 |
Total | 153.08 | 44.97 | 140.32 | 32.24 |
Source: Prisma Global Limited, Note 17 and Note 17.1 (pages 115-116) and Notes 35.2 and 35.3 (pages 127-128) of the Revised Annual Report FY2025-26. The Note 35 relationship labels are the company's. The total of Rs 153.08 crore equals the Rs 15,307.78 lakh related-party line in Note 17. All of these loans are classed as current borrowings.
Of the Rs 307.71 crore of gross borrowings, Rs 153.08 crore, or 49.75%, is owed to three related parties, all classed as current. Maryann Shreeram Iyer and Maas AI Private Limited both lend at 1% per month, payable on demand. Shreeram Subramaniam Iyer's loan is interest free. Note 35 labels the two individuals as key management personnel and describes Maas AI as an entity in which directors exercise control; the pages we read do not say which directors. Maas AI lent Rs 103.43 crore during FY26 and was repaid Rs 2.12 crore, so most of the Rs 101.31 crore balance is new this year.
Two of the three loans carry interest at 1% per month. The finance cost note we read lists interest on advance-tax shortfall, the Investec facility and a bank overdraft, and has no separate line for interest on related-party loans. That interest may be recorded within another line or elsewhere in the accounts; we did not trace it, and we raise it only as a reconciliation question for the company, not as a finding or a claim about intent.
Prisma Global Standalone Balances And Flows With The Holding Company, Rs Crore
Rs crore | FY26 / Mar 31, 2026 | FY25 / Mar 31, 2025 |
|---|---|---|
Sales of services to Prisma AI Corporation Pte Ltd (holding company) | 66.23 | 32.06 |
Trade receivable from the holding company | 59.56 | 32.44 |
Advances given to the holding company | 44.66 | 23.31 |
Holding company trade receivable as share of total trade receivables (derived) | 27.3% | 19.0% |
Sales to the holding company as share of standalone revenue (derived) | 5.9% | 4.7% |
Source: Prisma Global Limited, Notes 35.2 and 35.3 (pages 127-128) and Note 23.2 (page 119) of the Revised Annual Report FY2025-26. Shares are derived by Priveq.
The holding company, Prisma AI Corporation Pte Ltd, which holds 76.64% of Prisma, is also a customer and a debtor. Sales to it were Rs 66.23 crore in FY26 (5.9% of revenue), the trade receivable from it was Rs 59.56 crore (27.3% of trade receivables), and advances given to it were Rs 44.66 crore. That is a smaller concentration than the loan balances suggest, and we do not describe it as revenue concentration. The consolidated auditor's CARO report separately notes advances to related parties of Rs 46.51 crore with no schedule for repayment of principal and payment of interest produced. Overhead reimbursements in FY26 were Rs 6.79 crore to the subsidiary and Rs 3.70 crore to the holding company; key management remuneration was Rs 0.12 crore.
Net read : Half of the borrowings come from insiders on demand terms, which supports the company in the short run and leaves the funding mix dependent on those parties' willingness to keep lending.
Restated FY25 : What Ind AS Changed
Prisma Global Limited's FY25 profit after tax was Rs 7.30 crore under the previous GAAP and Rs 25.07 crore as restated for Ind AS, which includes an Rs 18.63 crore income-tax rectification (Note 40, pages 135 to 136).
Prisma Global FY25 Restatement On First-Time Ind AS Adoption, Standalone, Rs Crore
Rs crore | FY25 profit after tax | Equity at Mar 31, 2025 | Equity at Apr 1, 2024 |
|---|---|---|---|
As audited under previous GAAP | 7.30 | 103.34 | 94.39 |
Rectification of over-provision of income tax (Note 40.4a) | 18.63 | 18.63 | nil |
Ind AS adjustments, total | 0.47 | (56.44) | (56.88) |
of which revenue recognition | (5.91) | (48.73) | (42.82) |
of which effective interest rate on borrowings | 9.02 | not read | not read |
of which deferred tax | (3.25) | not read | not read |
of which lease, gratuity, deposits and forex (four lines summed) | 0.61 | not read | not read |
Under Ind AS | 26.40 | 65.54 | 37.51 |
Source: Prisma Global Limited, Note 40.1, 40.2 and 40.4 (pages 135-136) of the Revised Annual Report FY2025-26. The Ind AS profit line in Note 40.2 is Rs 26.40 crore; the Directors' Report and Note 16.2 show FY25 profit of Rs 25.07 crore, and the Rs 1.33 crore difference equals the FY25 foreign currency translation reserve movement in Note 16.4 (derived). Previous-GAAP figures are as originally audited. The Ind AS adjustment total and the revenue recognition line were read for profit and for equity; the other adjustment lines were read for profit only. The last profit row sums four filed lines (lease, gratuity, security deposits, forex), added by Priveq. Rows may differ from totals by rounding.
Under the previous GAAP, FY25 profit after tax was Rs 7.30 crore. Prisma then corrected an over-provision of income tax of Rs 18.63 crore and applied Ind AS adjustments totalling Rs 0.47 crore, reaching Rs 26.40 crore on the Ind AS statement. The Directors' Report and Note 16.2 show Rs 25.07 crore; the gap of Rs 1.33 crore matches the FY25 foreign currency translation reserve movement, a match we derived. Equity was cut the most by revenue recognition: Rs 48.73 crore at March 31, 2025. Total equity under Ind AS was Rs 65.54 crore against Rs 103.34 crore under the previous GAAP, before the Rs 18.63 crore rectification.
The practical point is that FY25 profit of Rs 25.07 crore, the base for the 72.7% profit growth, is a restated figure containing a Rs 18.63 crore tax reversal. Readers comparing against any earlier published FY25 number should use the restated one.
Net read: FY25 was a low and restated base, which flatters the 72.7% profit growth; the FY26 level of Rs 43.31 crore is the cleaner anchor.
Deferred Revenue, Unbilled Revenue And Receivables
Prisma Global Limited's deferred revenue rose 37.9% to Rs 150.97 crore at March 31, 2026, slower than revenue growth of 64.7% (Notes 20 and 23.2, pages 118 to 119).
Prisma Global Contract Balances And Receivables, Standalone, Rs Crore
Rs crore | Mar 31, 2026 | Mar 31, 2025 | Apr 1, 2024 |
|---|---|---|---|
Deferred revenue (contract liability) | 150.97 | 109.49 | 20.20 |
Unbilled revenue (contract asset) | 75.86 | 45.77 | 25.65 |
Trade receivables | 218.17 | 170.69 | 89.59 |
Deferred revenue as share of revenue (derived) | 13.5% | 16.1% | not read |
Receivable days on year revenue (derived) | 71 | 92 | not read |
Source: Prisma Global Limited, Notes 20 and 23.2 (pages 118-119) of the Revised Annual Report FY2025-26. Share of revenue and receivable days are derived by Priveq from year-end balances and full-year revenue.
Deferred revenue, the cash billed ahead of delivery, rose 37.9% to Rs 150.97 crore, slower than revenue, so it fell from 16.1% to 13.5% of revenue. Unbilled revenue, work delivered but not yet billed, rose 65.8% to Rs 75.86 crore, in line with revenue. Trade receivables rose 27.8% to Rs 218.17 crore, and on year-end balances receivable days improved from 92 to 71. Our read: collections improved and the book is still growing, but customers are prepaying a smaller share of the work than before, which leaves more of the funding gap to borrowing.
Net read: Collections improved, but customers prepay a smaller share of the work, so working capital is increasingly funded by debt.
Why Price To Sales And EV/EBITDA Lead Here
At the Priveq desk price of Rs 8,600 as of October 19, 2026, Prisma Global Limited trades at 3.87x consolidated sales and 99.1x consolidated earnings (derived by Priveq from the annual report).
P/E is not ruled out, but it is a poor lead for this business. P/E equals price to sales divided by net margin, so with a net margin of 3.9% a small change in margin or tax moves P/E a great deal. Prisma's effective tax rate moved from 34.6% to 47.8% in one year, and its profit before tax is thin against its sales. P/S shows what the market pays for each rupee of revenue and EV/EBITDA adds the debt, which matters at 2.29 times net debt to equity. P/E stays in the table as a cross-check, and the scenarios below show how fast it falls if margins improve.
Prisma Global Valuation At The Priveq Desk Price Of Rs 8,600 (As Of October 19, 2026)
Metric | Value | How it is built | Tag |
|---|---|---|---|
Shares in issue | 50,29,561 | Directors' Report item 5; Note 15.3 | disclosed |
Market capitalisation | Rs 4,325.42 crore | Rs 8,600 x 50,29,561 shares | derived |
Price to sales (consolidated) | 3.87x | Rs 4,325.42 crore / Rs 1,119.09 crore | derived |
Net profit margin (consolidated) | 3.9% | Rs 43.63 crore / Rs 1,119.09 crore | derived |
Price to earnings (consolidated) | 99.1x | Rs 8,600 / EPS Rs 86.76 | derived |
Enterprise value (standalone net debt) | Rs 4,597.91 crore | Rs 4,325.42 crore + Rs 272.49 crore net debt | derived |
EV to operating EBITDA (standalone) | 37.0x | Rs 4,597.91 crore / Rs 124.32 crore | derived |
Price to book (standalone) | 36.4x | Rs 8,600 / Rs 236.4 book value per share | derived |
Desk price is a Priveq observation of unlisted market activity as of October 19, 2026, not an exchange price. Share count, revenue, profit and EPS are from the Revised Annual Report FY2025-26; every multiple here is derived by Priveq and moves with the price. Enterprise value uses standalone net debt because consolidated net debt was not read.
On the same desk price, Prisma AI is at 3.87x sales, 37.0x EV/EBITDA and 99.1x earnings. Price to book of 36.4x is shown for completeness; with equity of Rs 118.89 crore after restatement it says little about value.
Prisma can also be its own benchmark. At the same Rs 8,600 price, the standalone multiple on FY25 numbers would have been 6.4x sales and 174.2x earnings (on FY25 EPS of Rs 49.36). A year of 64.7% revenue growth has compressed the sales multiple to 3.9x and the earnings multiple to 99.1x without the price moving. That is the useful thing about a fast grower: the price can look high on last year's numbers and moderate on this year's. The question is whether it can do it again.
Prisma AI Against Layer 4 Peers
At the October 16, 2026 close, Axon traded at 9.9x sales and Samsara at 12.5x, against Prisma AI's 3.87x at the desk price as of October 19, 2026 (StockAnalysis, a secondary source).
Layer Multiples And Layer 4 Peers (Listed, Secondary-Source Data)
Layer | Company | Trailing P/E | Forward P/E | P/S | Net margin | 3-yr revenue forecast (consensus) | As of |
|---|---|---|---|---|---|---|---|
1. Compute | NVIDIA | 27.1x | 17.7x | 17.1x | 63.7% | 61.12% | Oct 16, 2026 |
1-2. India AI servers | Netweb Technologies | 103.1x | 65.9x | 10.0x | 9.7% | 47.42% | Oct 16, 2026 |
2. Power and cooling | Vertiv | 46.7x | 26.0x | 6.9x | 15.1% | not shown | Oct 16, 2026 |
3. Cloud and models | Microsoft | 29.5x | 26.8x | 11.8x | 40.3% | not shown | Oct 16, 2026 |
4. Applications | Palantir | 159.1x | 98.0x | 72.6x | 49.0% | 58.59% | Oct 16, 2026 |
4. Applications | Axon | 162.3x | 43.5x | 9.9x | 6.2% | 30.71% | Oct 16, 2026 |
4. Applications | Samsara | 257.3x | 46.9x | 12.5x | 4.9% | 21.72% | Oct 16, 2026 |
4. Applications | Clear Secure | 29.9x | 19.3x | 5.9x | 14.8% | not shown | Oct 16, 2026 |
4. Applications | Cognyte | n/a (near-zero earnings) | 13.8x | 1.5x | about 0% | not shown | Oct 16, 2026 |
4. Applications | Mobileye | n/a (loss-making) | 17.2x | 3.0x | loss-making | 11.87% | Oct 16, 2026 |
5. Services | EPAM Systems | 16.5x | 9.0x | 1.1x | 7.2% | 3.96% | Oct 16, 2026 |
Prisma AI (desk price) | 99.1x | 60.1x to 70.8x (scenario) | 3.87x | 3.9% | no guidance | Oct 19, 2026 |
Source: StockAnalysis statistics pages for each company (prices at the October 16, 2026 close, pages read on October 18, 2026); secondary sources, refreshed for this publication. ICICIdirect shows a different trailing P/E for Netweb Technologies (107.9x); the two are not blended, and the StockAnalysis figure is used for consistency with the other rows. The 3-year revenue figure is each page's analyst-consensus forecast, not trailing growth, and is not comparable with Prisma's single-year FY26 growth. Axon (1.73% operating margin) and Samsara (1.05%) trailing P/E ratios are artifacts of near-zero earnings, not clean anchors. Prisma's forward P/E is a Priveq scenario: today's 99.1x divided by 1.65 and 1.40 (EPS growth of 65% and 40%), not a forecast. Palantir, Axon, Samsara, Clear Secure, Cognyte, Mobileye and EPAM are listed businesses and not like-for-like comparables.
No listed company is a direct match for Prisma AI, and the large IT services names are mature businesses, so they are context and not the comparison. The closest layer 4 profiles are Axon and Samsara: application companies with thin net margins (6.2% and 4.9%) that the market pays for durable recurring revenue and growth. On price to sales, Prisma AI at 3.9x is about 61% below Axon (9.9x) and 69% below Samsara (12.5x). The context names Cognyte (1.5x) and Mobileye (3.0x) sit lower, and EPAM at 1.1x shows where a services-priced company trades. Prisma AI sits between them.
On earnings the picture reverses. If Prisma's EPS grew 40% in FY27, the desk price implies a forward P/E of 70.8x; at 65% it is 60.1x. Axon is at 43.5x forward and Samsara at 46.9x, so Prisma would be 63% and 51% above them at 40% growth, and 38% and 28% above at 65%. Those Prisma figures are Priveq scenarios, not forecasts.
Reading both together, Prisma is cheaper than layer 4 peers per rupee of sales and dearer per rupee of earnings. Our read is that the sales discount is the market's likely price for what the filing does not show (recurring share of revenue, customer mix, gross margin and listed-market liquidity), and that the earnings premium reflects a company whose margin has to expand to justify the price. Palantir's 72.6x sales is an outlier and not an anchor. Axon's and Samsara's trailing P/E ratios of 162x and 257x are distorted by near-zero operating margins.
Net read: Prisma AI is priced like a company the market does not yet trust to convert growth into earnings: low on sales, high on earnings. All peer figures are secondary-source data at the October 16, 2026 close, read on October 18, 2026, and move daily.
What The Price Assumes
At Rs 8,600 as of October 19, 2026, Prisma AI needs consolidated EPS of about Rs 286.7 to trade at 30 times earnings, 3.3 times its FY26 EPS of Rs 86.76 (Priveq scenario).
What Rs 8,600 Requires: EPS Needed For A Target P/E, And Years To Get There (Scenario)
Target P/E | EPS required | Multiple of FY26 EPS (Rs 86.76) | Years at 30% EPS growth | Years at 40% | Years at 50% |
|---|---|---|---|---|---|
20x | Rs 430.0 | 4.96x | 6.1 | 4.8 | 3.9 |
30x | Rs 286.7 | 3.30x | 4.6 | 3.6 | 2.9 |
50x | Rs 172.0 | 1.98x | 2.6 | 2.0 | 1.7 |
Priveq desk scenario, not company guidance. Built on consolidated FY26 EPS of Rs 86.76, a constant Rs 8,600 price (as of October 19, 2026) and a constant share count. The key assumption is the EPS growth rate; the proposed ESOP 2026 would add dilution that this table does not model.
This table asks what EPS the Rs 8,600 price needs to look like a normal multiple. To trade at 30x, EPS would need to reach about Rs 286.7, 3.3 times FY26's Rs 86.76. At 40% a year that takes about 3.6 years; at 30% a year, about 4.6 years. For a 50x multiple, the requirement is Rs 172.0 and about 2.1 years at 40%.
P/E At Rs 8,600 If Revenue Compounds And Net Margin Changes (Scenario)
Years | Revenue growth a year | Revenue, Rs crore | P/E at 3.9% net margin | P/E at 5% | P/E at 8% |
|---|---|---|---|---|---|
2 | 30% | 1,891 | 58.6x | 45.7x | 28.6x |
2 | 40% | 2,193 | 50.6x | 39.4x | 24.6x |
2 | 50% | 2,518 | 44.0x | 34.4x | 21.5x |
3 | 30% | 2,459 | 45.1x | 35.2x | 22.0x |
3 | 40% | 3,071 | 36.1x | 28.2x | 17.6x |
3 | 50% | 3,777 | 29.4x | 22.9x | 14.3x |
Priveq desk scenario, not company guidance. Base is consolidated FY26 revenue of Rs 1,119.09 crore and 3.9% net margin; the price (Rs 8,600, as of October 19, 2026) and share count (50,29,561) are held constant. The single assumption that moves the result most is net margin conversion: moving from 3.9% to 8% roughly halves the P/E at any growth rate.
The second table tests the other lever, margin. If revenue compounds at 40% for three years and net margin stays at 3.9%, the P/E at Rs 8,600 is 36.1x. If margin reaches 8%, it is 17.6x. The conclusion we draw is simple: growth alone carries the price to a reasonable multiple in about three years only if growth holds at 40% or more, and margin expansion matters about as much as growth. These are Priveq desk scenarios, not guidance. The company gives none.
Net read: Three years of 40% growth gets the price to about 36x earnings at today's margin and about 18x if margin reaches 8%, so margin is the swing factor.
Forward Indicators From The Filing And The Product
Prisma Global Limited's FY26 annual report gives no numeric guidance; the chairman's message (pages 5 to 6) lists priorities without targets.
The company states strategic priorities (deepening visual intelligence, expanding industry applications, scaling globally, responsible AI) with no numbers. We found no order book and no management discussion of outlook in the pages we reviewed. What follows are indicators to watch, drawn from the filing and the product, not forecasts.
Partner-led reach. Four global offices and 19 partner offices suggest growth is meant to come through partners, which can scale faster than a direct sales force but typically shares margin.
Deployment on existing cameras. The platform runs on installed networks, which lowers the cost of adoption. Whether that shows up as lower delivery cost per rupee of revenue is visible in the 28.0% proxy next year.
Borrowing for R&D. The Investec facility states research and development as its purpose. Product spend is being funded with foreign currency debt priced at SOFR plus 5%.
Market pace. One paid report, from Persistence Market Research (July 2026), sizes AI video analytics at US$7.4 billion in 2026 and US$51.1 billion by 2033, a compound rate of 31.8%. If Prisma only matched the market, the 40% to 65% EPS growth scenarios above would need margin expansion on top of volume.
Contract balances. Deferred revenue and unbilled revenue are the best in-filing read on pipeline. Deferred revenue grew slower than revenue this year.
Debt behaviour. Repayment or conversion of the on-demand insider loans, and the terms of the proposed Rs 200 crore NCD issue, will show whether the funding mix is shifting.
Disclosures Worth Reading Closely
Prisma Global Limited's consolidated auditor states that the Group does not have an internal audit system commensurate with its size and nature (CARO clause (xiv), page 144).
Prisma Global FY26 Disclosures Worth Reading Closely
Item | Where | What it says |
|---|---|---|
Internal controls | Directors' Report items 18(v) and 28 (item 28 is on page 62) | Item 18(v) says internal financial controls are adequate and operating effectively; item 28 says the company has foundational controls and is strengthening them, with corrective actions and formalised policies being implemented. |
Internal audit system | Consolidated Independent Auditor's Report, CARO clause (xiv) (page 144) | The auditor states that the Group does not have an internal audit system commensurate with the size and nature of its business. |
Auditor change | Directors' Report item 9 (page 57) | Due to a casual vacancy for Dixit Dattatray & Associates, Gujar and Kulkarni were appointed until the ensuing AGM; the board proposes Price Waterhouse Chartered Accountants LLP for five years. Consolidated CARO clause (xviii) states no statutory auditor resigned during the year; the report does not say when the vacancy arose. |
Late AGM, compounded | Directors' Report item 6 (page 56) | A Regional Director order compounded a default under Section 96 of the Companies Act, 2013 for holding the FY2022-23 AGM beyond the prescribed date. |
Proposed ESOP | Directors' Report item 5 (page 56) | Prisma proposes an ESOP 2026 and has increased its authorised share capital to Rs 30 crore. The scheme would add to the 50,29,561 shares in issue; its size is not modelled in this note. |
Shareholding change | Notes 15.3 and 15.4 (page 114) | Prisma AI Corporation Pte Ltd fell from 82.20% to 76.64%; Amitabh Roy Chowdhury from 6.59% to 4.42%; Shreeram Subramaniam Iyer rose from 1.29% to 1.95%. The filing does not say who acquired the shares. Page 114 is one of the three pages the company corrected on October 1, 2026. |
Revision of the report | Cover letter dated October 1, 2026 | The company states pages 27, 67 and 114 contained a clerical mistake and that nothing else was revised. The letter does not say what was corrected. |
Rating agency figures | Acuité rating rationale dated August 4, 2026 | ACUITE A / Stable on a proposed Rs 200 crore NCD issue, using provisional FY26 consolidated revenue of Rs 1,492.53 crore, PAT of Rs 161.60 crore, net worth of Rs 669.47 crore and gearing of 0.23x. These do not reconcile to the audited accounts. |
Source: Prisma Global Limited, Revised Annual Report FY2025-26 and cover letter dated October 1, 2026; Acuité Ratings and Research rating rationale for Prisma Global Limited dated August 4, 2026, as published on its website. The Acuité figures are provisional, from a different or unreconciled perimeter, and are shown for contrast only; Priveq does not use them in any calculation in this note.
These are statements the company or its auditor made, quoted for what they say. None of them is an allegation. The two that interact are the Directors' Report, which describes controls as adequate and operating effectively while also describing foundational controls being strengthened, and the consolidated auditor's remark on the internal audit system. Readers should read the original text, and we did not interpret the legal effect of the compounded default or the auditor change.
The Acuité rationale deserves a separate sentence. It rates a proposed Rs 200 crore NCD at ACUITE A / Stable and cites FY26 revenue of Rs 1,492.53 crore and profit of Rs 161.60 crore, which are not the audited figures. We do not use them in any calculation and cannot say why they differ, whether through perimeter, timing or definition.
The Desk View
Priveq's read, as of October 19, 2026 and a desk price of Rs 8,600, is that Prisma AI's price assumes margin expansion that the FY26 filing does not yet show. The desk price reflects unlisted market activity, not an independent Priveq valuation call.
The growth is real. Revenue up 64.7%, profit up 72.7% and receivable days down from 92 to 71, all in audited numbers.
The funding is the constraint. Gross borrowings of Rs 307.71 crore, half from insiders on demand terms, a working capital deficit and a restated base mean the growth is financed on terms that can change quickly.
The price rests on margin. At 3.87x sales Prisma AI is below layer 4 peers, and at 99.1x earnings it is above them. On our scenarios the price implies a P/E of about 18x to 36x three years out at 40% revenue growth, and about 22x to 45x at 30% growth, depending on whether net margin reaches 8% or stays at 3.9%. Those are the error bars, and they are scenarios, not forecasts.
The one variable that would change this read is gross margin. A proxy moving above today's 28.0% would justify more of the premium on earnings; a proxy that stays flat while revenue grows would not. Three things would strengthen our confidence: a gross margin figure that moves, a reconciliation of interest on the related-party loans to the finance cost note, and a recurring-revenue split the filing does not give.
Priveq transacts in Prisma Global shares as a named counterparty, so our view and our commercial interest sit in the same place. Weigh this note accordingly, and check each figure against the filing.
What This Means, By Situation
These blocks are informational only and are not advice. Priveq is not registered with SEBI to give investment advice.
If you already hold this position: The items to track are the next results' gross margin proxy, any repayment, refinancing or conversion of the on-demand related-party loans, the quarterly repayments on the Investec facility, the size of the proposed ESOP 2026, and the company's explanation of what changed on pages 27, 67 and 114.
If you are evaluating a first position: The minimum lot on the Priveq portal is 100 shares, about Rs 8,60,000 at the desk price as of October 19, 2026. Unlisted shares are illiquid and the filing shows a leveraged balance sheet with insider funding; the questions that matter most are what margin the business can reach and how the loans are refinanced. Confirm the price with the desk before any transaction.
If you are advising a client on this: The documents worth requesting are the Notes 17, 35 and 40 to the standalone statements, the consolidated auditor's report including the CARO remarks, and the company's reconciliation of interest on related-party loans. The two figures a client will compare, 3.9x sales and 99.1x earnings, move with the price and should be refreshed.
FAQs
Q1. How much of Prisma AI's borrowing is owed to related parties?
A1. Rs 153.08 crore of Rs 307.71 crore, or 49.75%, at March 31, 2026. The lenders are Maryann Iyer, Shreeram Iyer and Maas AI Private Limited, all classed as current, with the two interest-bearing loans at 1% per month and payable on demand (Note 17.1).
Q2. What is the Prisma AI unlisted share price today?
A2. The Priveq desk price is Rs 8,600 per share as of October 19, 2026. Desk prices are indicative, reflect unlisted market activity and move without notice, so confirm with the desk before transacting.
Q3. Has Prisma AI's FY26 annual report been revised?
A3. Yes. The company re-submitted it on October 1, 2026 and says pages 27, 67 and 114 had a clerical mistake. It states nothing else changed; it does not say what was corrected.
Q4. What about Prisma AI is still unverified?
A4. Five items remain open after reading the filing. They are:
Where interest on the related-party loans sits in the finance cost lines (the note we read has no separate line).
What exactly was corrected on pages 27, 67 and 114.
Why employee benefits expense fell from Rs 16.92 crore to Rs 2.59 crore as revenue grew.
Why the Acuité rating note's FY26 revenue and profit differ from the audited accounts.
The split of revenue by product, customer or region, which the filing does not give.
Q5. What does price to sales mean for Prisma AI, and why not price to earnings?
A5. Price to sales is market value per rupee of annual revenue, about 3.87x for Prisma AI at the desk price. P/E equals price to sales divided by net margin (3.9%), so thin or taxed earnings make P/E swing; it stays as a cross-check.
Q6. Where does Prisma AI sit in the AI stack?
A6. Layer 4, applications, by what it sells; its cost base resembles layer 5, services. The filing describes no chip or data-centre business. See Table 9 for the full five-layer map.
Q7. How does Prisma AI compare with Axon and Samsara?
A7. Cheaper on sales, dearer on earnings. At the desk price Prisma AI is at 3.87x sales against 9.9x for Axon and 12.5x for Samsara, but its scenario forward P/E of 60.1x to 70.8x is above their 43.5x and 46.9x (as of October 16, 2026).
Q8. How do I buy Prisma AI unlisted shares?
A8. Express buy interest on the Prisma Global page of the Priveq Marketplace; the minimum lot is 100 shares. At the desk price of Rs 8,600 (as of October 19, 2026) that is Rs 8,60,000, and the interest is no-commitment: the desk reaches out.
Q9. Is Prisma AI's borrowing from insiders a concern?
A9. The filing discloses it plainly, and it is the main balance-sheet question; we do not draw conclusions about intent. The loans are payable on demand, so the funding depends on the lenders continuing to lend. We would watch for repayment or refinancing in the next filing.
Q10. Is Prisma AI a good buy at Rs 8,600?
A10. We cannot advise on that. What we can say is what the price assumes: EPS roughly three times FY26's for a 30x multiple, or net margin expansion from 3.9% towards 8%, over about three to four years.
Q11. Why is the Acuité revenue figure so different from the annual report?
A11. We do not know. Acuité cites provisional FY26 consolidated revenue of Rs 1,492.53 crore against the audited Rs 1,119.09 crore, and we did not reconcile the two.
What We Can And Cannot Stand Behind
Disclosed in the filing (we stand behind these as read):
Revenue, profit, EPS and the share count.
Borrowings, related-party loan terms and balances, and the company's own net debt to equity of 2.29 times.
The Ind AS restatement lines and the contract balances.
The auditor's internal audit remark and the revision statement.
Derived by Priveq (our arithmetic, checkable from the filing):
Gross borrowings, the gross margin proxy, operating EBITDA, current ratio and receivable days.
Shares of revenue and receivables, and the share of borrowings owed to related parties.
Every multiple at the Rs 8,600 desk price (as of October 19, 2026).
Scenarios (Priveq desk, not guidance):
The forward P/E range, the EPS break-even table and the margin and growth grid.
Key assumptions: EPS growth, net margin conversion, a constant price and a constant share count. ESOP dilution is not modelled.
What we cannot stand behind:
Whether and where interest on the related-party loans is reflected in the finance cost lines we read.
Why employee cost fell, and what was corrected on pages 27, 67 and 114.
Why the Acuité figures differ from the audited accounts.
The revenue split by product, customer or region, and any forward growth for Prisma AI.
Peer multiples and the market-size estimate, which are secondary-source figures that move with prices; the desk price is indicative.
Primary Sources
Prisma Global Limited, Revised Annual Report FY2025-26, filed with the NSE: Chairman's message (pages 5 to 6); milestones and product pages (pages 8, 11 to 14); Directors' Report (pages 55 to 62); Notes 15, 17, 20, 23, 25 to 29, 35, 36 and 40 to the standalone financial statements (pages 114 to 136); consolidated Independent Auditor's Report, CARO clauses (iii), (ix), (xiv) and (xviii) (pages 143 to 144).
Prisma Global Limited, cover letter dated October 1, 2026, re-submitting the report, and the original letter dated September 3, 2026 it refers to.
Acuité Ratings and Research, rating rationale for Prisma Global Limited dated August 4, 2026: Acuité rating page.
Secondary sources, not used for any fact about Prisma AI: StockAnalysis statistics pages (peer multiples at the October 16, 2026 close); ICICIdirect (Netweb Technologies, noted only as a differing trailing P/E); Persistence Market Research (July 2026, AI video analytics market size).
Talk to the desk: WhatsApp +91 82874 66698 | support@priveq.in | View Prisma Global on the Priveq Marketplace
Disclaimer: This piece reflects Priveq India's (Priveq Investech Private Limited, Priveq.in) own research, based on primary filings, regulatory disclosures, and the company's own audited financial statements as detailed above. It is not investment advice, and does not allege any wrongdoing, misstatement, or violation by Prisma Global Limited; the related-party loans, borrowings, controls remarks and other findings noted in this piece are read directly from the company's own public disclosures. Priveq Investech Private Limited is not registered with the Securities and Exchange Board of India (SEBI) as a stock broker, investment adviser, or research analyst. This piece is independent desk research and commentary, not "research" as defined under the SEBI (Research Analysts) Regulations, 2014, and should not be construed as investment advice from a SEBI-registered entity. Priveq transacts as a named counterparty in the unlisted shares discussed here, including Prisma Global Limited, and may hold or deal in these shares before, during, or after publication; our commercial interest and the views in this piece sit in the same place, and should be weighed accordingly. Desk prices are indicative, subject to change without notice, and should be confirmed directly with the desk before any transaction. Unlisted securities are illiquid, carry a high risk of loss, and may be difficult to value or sell; prices move sharply and without notice. Readers should independently verify all figures against the company's own filings and consult qualified financial and legal advisors before transacting. Past performance and price appreciation referenced here are not indicative of future results.