


The short version
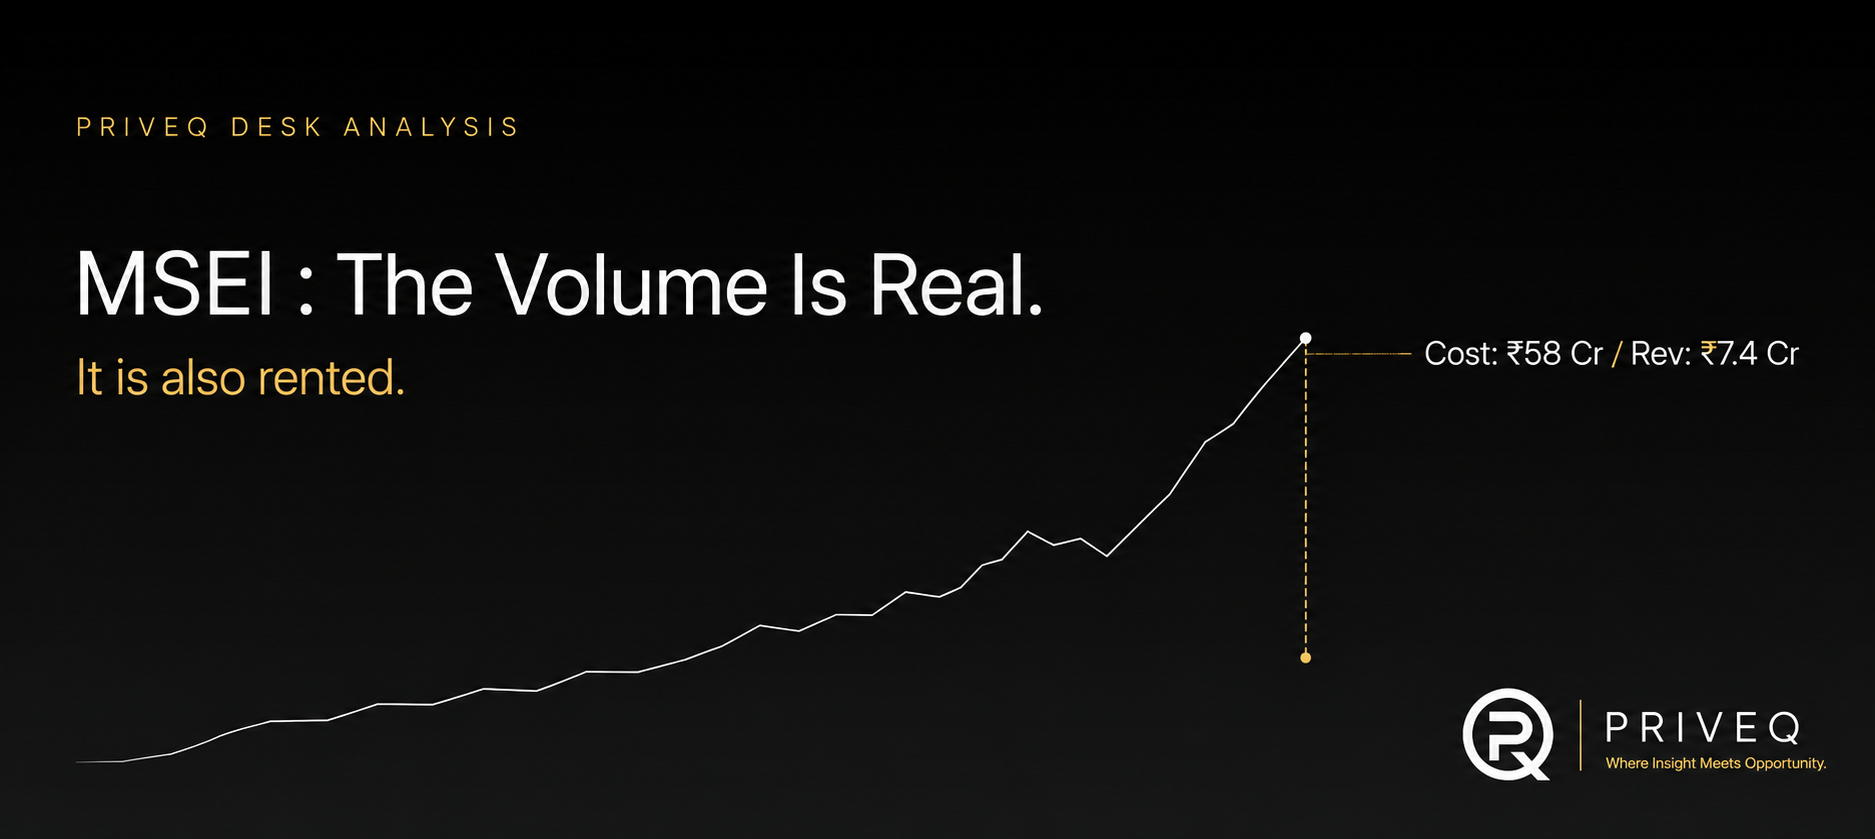
MSE is now trading close to ₹500 crore of equities a day, against roughly ₹0.31 crore a day a year ago. That part is real and it is verifiable from the exchange's own trade data. What is less discussed is that the exchange is paying for it. A second liquidity scheme took effect on 1 July 2026 and volumes stepped up 41% on day one. On our estimate the scheme costs somewhere between ₹52 crore and ₹58 crore a year in incentives, against transaction revenue of roughly ₹7 crore a year even if MSE charged full market rates, which it currently does not because charges are waived for the participants generating the volume. At ₹5.75 a share the market is valuing MSE around ₹6,325 crore, against ₹1,369 crore of net assets and 0.26% of the cash equity market. Our view : The operational progress is genuine, the price is not supported by it, and the real bull case sits in derivatives rather than in the volume chart everyone is quoting.
Metric | Value | Why it matters |
|---|---|---|
Current price | ₹5.75 per share | Priveq desk level, 23 July 2026 |
Implied equity value | ~₹6,325 crore | On approximately 11.0 billion shares |
Total equity | ₹1,369 crore | Price is about 4.6 times book |
Last primary round | ₹2.00 per share | August 2025, registered valuer's mark |
July 2026 turnover | ₹498 crore a day | Up 185% on June |
Estimated scheme cost | ₹52 to 58 crore a year | Our estimate from the published schedule |
Revenue at full market rates | ~₹7.4 crore a year | On current volume, if charges were not waived |
FY26 revenue from operations | ₹3.38 crore | Fourth consecutive annual decline |
Cash equity market share | ~0.26% | Against NSE daily cash turnover |
Next scheme expiry | 30 September 2026 | The most informative date on the calendar |
View | Real progress, unsupported price | The option, not the volume, carries the value |
On 22 July 2026, the Metropolitan Stock Exchange traded ₹457.41 crore of equities across 94,314 trades in 142 scrips. A year earlier, in July 2025, the same exchange averaged about half a crore a day, sometimes in a single stock.
That is one of the sharpest turnarounds in Indian market infrastructure, and it has gone almost entirely unreported, because the evidence sits in a downloadable trade file rather than in a press release.
We should say plainly that we got this wrong the first time. Our working assumption was that the April volume surge was bought, that the incentives behind it were due to lapse at the end of June, and that the numbers would deflate once they did. The tape said otherwise. July volumes are running at nearly three times June, on more scrips, more trades and larger tickets. When the evidence goes against the thesis, the thesis moves.
But the reason it moved is not the one a holder would hope for. The scheme did not end. It was replaced with a bigger one.
What actually happened on 1 July
MSE issued circular MSE/BD/19161/2026 on 8 June 2026, introducing a second Liquidity Enhancement Scheme for the equity segment. The circular is explicit on timing: LES-II took effect from 1 July 2026 and runs until 30 September 2026.
Now line that up against the exchange's own turnover data.
The last trading day under the first scheme, 30 June, saw ₹273.20 crore (₹27,320 lakh in MSE's published data). The first day under the second scheme, 1 July, saw ₹385.94 crore. That is a 41% step up on day one. The monthly averages tell the same story: ₹174.7 crore a day in June, ₹497.9 crore a day in July to the 22nd, a rise of 185%.
Volumes did not become self-sustaining when the first scheme reached its end date. A more generous scheme started the next morning, and the tape moved with it. That is the correlation, and it is difficult to read another way.
MSE's Monthly Equity Turnover (Source : MSE's Trade Summary Data) -
Month | Average per day | Total turnover | Trades | Scrips |
|---|---|---|---|---|
Jul 2025 | ₹0.5 crore | ₹12.0 crore | 212 | 2 |
Oct 2025 | ₹0.5 crore | ₹9.1 crore | 575 | 3 |
Jan 2026 | Negligible | Negligible | 70 | 6 |
Feb 2026 | ₹0.8 crore | ₹17.4 crore | 125,872 | 129 |
Mar 2026 | ₹0.9 crore | ₹17.7 crore | 233,313 | 124 |
Apr 2026 | ₹179 crore | ₹3,579 crore | 1,108,369 | 147 |
May 2026 | ₹223 crore | ₹4,231 crore | 1,106,515 | 144 |
Jun 2026 | ₹175 crore | ₹3,668 crore | 1,029,748 | 137 |
Jul 2026 (to 22nd) | ₹498 crore | ₹7,966 crore | 1,707,101 | 149 |
The 1 July Step Change :
Date | Turnover | Trades | Scheme |
|---|---|---|---|
25 Jun 2026 | ₹188.4 crore | 50,808 | LES-I |
29 Jun 2026 | ₹207.9 crore | 69,963 | LES-I |
30 Jun 2026 | ₹273.2 crore | 73,248 | LES-I, final day |
1 Jul 2026 | ₹385.9 crore | 93,786 | LES-II, day one |
3 Jul 2026 | ₹485.0 crore | 110,718 | LES-II |
8 Jul 2026 | ₹658.8 crore | 142,945 | LES-II |
10 Jul 2026 | ₹712.5 crore | 146,686 | LES-II, peak to date |
22 Jul 2026 | ₹457.4 crore | 94,314 | LES-II |
The scheme, and What it Pays
The terms are worth setting out, because most coverage of MSE's volumes has not looked at them.
Under LES-II, designated market makers must be active trading members with a minimum net worth of ₹1 crore. Each carries an average daily trading volume obligation of ₹100 crore for the month. They must hold two-way quotes across the top five levels of the order book, with minimum bid and offer values rising from ₹50,000 at the top line to ₹1,50,000 at the fifth, and maximum spreads as tight as 5 basis points at the top line for stocks above ₹40. Presence obligations run to 90% of the opening and closing sessions and 85% of the main session. The exchange appoints three or more market makers, and the eligible list runs to 140 securities.
In return, per market maker per month:
₹20 lakh for meeting presence requirements
₹3,200 per crore on achieving average daily trading volume of ₹100 crore
A further ₹3,400 per crore on average daily volume above ₹100 crore, capped at ₹200 crore
₹5 lakh to the market maker showing highest presence
₹5 lakh to each market maker contributing ₹100 crore of volume every trading day
And, in the circular's own words, transaction charges payable to the exchange are waived for designated market makers under the scheme.
So the participants generating the bulk of the turnover are paid to generate it, and pay nothing to the exchange for doing so.
None of this is improper, and it is not hidden. The scheme is published, SEBI-sanctioned under the relevant master circular, and its stated objective is creating lasting and self-sustaining liquidity. Buying liquidity to reach critical mass is a legitimate strategy and other exchanges have used versions of it. The point is narrower: the volume chart being circulated as evidence of a turnaround is, to a substantial degree, a picture of spending.
What the Scheme Pays :
Component | Amount | Condition |
|---|---|---|
Presence incentive | ₹20 lakh per month | Meeting order book presence obligations |
Volume incentive | ₹3,200 per crore | On average daily volume of ₹100 crore |
Additional volume incentive | ₹3,400 per crore | Above ₹100 crore, capped at ₹200 crore ADTV |
Highest presence bonus | ₹5 lakh per month | To the market maker with highest presence |
Daily volume bonus | ₹5 lakh per month | ₹100 crore contributed every trading day |
Transaction charges | Waived | For designated market makers under the scheme |
What the volume costs
Work the incentive schedule against observed volumes and the cost becomes estimable.
At July's average of ₹497.9 crore a day, split across three to five market makers, each is running between roughly ₹100 crore and ₹166 crore of average daily volume, which sits neatly inside the incentive bands. Applying the schedule gives roughly ₹4.3 crore to ₹4.9 crore a month, or ₹52 crore to ₹58 crore annualised.
Two features of the design are worth noticing. The incremental incentive caps at ₹200 crore of average daily volume per market maker, so with three or more makers the paid ceiling sits somewhere around ₹600 crore a day. July is averaging ₹498 crore, which means volume is running close to the level at which paying for more stops. And while the circular excludes trades where the same client code appears on both sides, a trade between two different market makers still counts. Some portion of the printed turnover can therefore circulate between paid participants without representing external demand.
We would treat our cost estimate as an estimate. The circular's wording on the per-crore incentive admits more than one reading, and the exact number of appointed market makers is not public. The order of magnitude is what matters, and the order of magnitude is tens of crores a year.
The Revenue That is not there
Here is the part that decides the investment case.
Indian exchanges charge for cash equity trades. NSE levies ₹2.97 per lakh of traded value on each side, which works out to roughly ₹594 per crore of turnover once both sides are counted. BSE's equivalent is ₹3.75 per lakh on its main groups.
Apply NSE's rate to MSE's current run rate. July's ₹497.9 crore a day annualises to about ₹1.24 lakh crore of turnover. At ₹594 per crore, that generates roughly ₹7.39 crore a year of transaction revenue.
Set that against the ₹52 crore to ₹58 crore of incentives.
So even in a world where MSE stopped waiving fees tomorrow and charged exactly what NSE charges, the current volume would still cost the exchange around ₹48 crore a year more than it earns. In the actual world, where charges are waived for the market makers, it earns considerably less than that.
To simply cover the incentive cost at full market rates, MSE would need about ₹3,700 crore of turnover a day. That is roughly 7.4 times where it is now.
Volume Against Revenue :
Measure | Figure | Basis |
|---|---|---|
July 2026 average daily turnover | ₹498 crore | MSE trade summary data |
Annualised turnover | ~₹1.24 lakh crore | 250 trading days |
NSE cash transaction charge | ₹2.97 per lakh per side | ~₹594 per crore, both sides |
Revenue at full NSE rates | ~₹7.4 crore a year | On current volume |
Estimated incentive cost | ₹52 to 58 crore a year | Our estimate from the schedule |
Net drain at full rates | ~₹48 crore a year | Before the waiver is even considered |
Turnover needed to cover incentives | ~₹3,700 crore a day | 7.4 times current volume |
Where the operating business actually is
The volume story is new. The financial story is not, and it runs the other way.
Year | Revenue from operations | Change | Net loss | Source |
|---|---|---|---|---|
FY23 | ₹9.21 crore |
| ₹18.66 crore | Audited filing |
FY24 | ₹7.36 crore | -20.1% | ₹48.75 crore | Audited filing |
FY25 | ₹4.31 crore | -41.4% | ₹34.22 crore | Annual return / reported |
FY26 | ₹3.38 crore | -21.6% | ₹25.84 crore | Reported, not primary-verified |
From the audited FY24 filing and the FY25 annual return lodged with the Registrar of Companies, plus the FY26 results, revenue from operations has gone: ₹9.21 crore in FY23, ₹7.36 crore in FY24, ₹4.31 crore in FY25, ₹3.38 crore in FY26. That is a 63% decline across four years, in a period when Indian market volumes were rising.
FY26 also shows how the reported loss narrowed. The loss fell from ₹34.22 crore to ₹25.84 crore, which reads as progress until you look at the composition. Other income rose from ₹13.07 crore to ₹55.69 crore, of which about ₹40.14 crore was interest on financial assets. Total expenses rose from ₹52.23 crore to ₹84.91 crore. So the improvement came from interest earned on the capital raised, not from the exchange business.
One timing point matters and is widely missed. FY26 ended on 31 March 2026. Market makers went live on 1 April 2026. Not a single rupee of the volume surge appears in any FY26 figure. The first financial evidence of whether this strategy converts will be the September 2026 half-year numbers, and even those will cover a period in which charges were waived.
What ₹5.75 implies
Metropolitan Stock Exchange (MSEI) is clearing at ₹5.75 a share on our desk as at 23 July 2026.
Earnings multiple | Net profit needed | Turnover needed per day | Share of NSE cash volume | Multiple of today |
|---|---|---|---|---|
40x | ₹158 crore | ₹16,218 crore | 8.5% | 33x |
30x | ₹211 crore | ₹20,950 crore | 11.0% | 42x |
25x | ₹253 crore | ₹24,736 crore | 13.0% | 50x |
MSE's current cash equity market share is approximately 0.26%. | ||||
The share count is verifiable in part and derived in part. The annual return filed with the Registrar for FY25 records 6,000,217,033 equity shares of ₹1 face value as at 31 March 2025, up from 4,810,217,033 a year earlier after a private placement of 1,190,000,000 shares. In August 2025 the exchange allotted a further 500 crore shares at ₹2, being ₹1 face value plus ₹1 premium, raising ₹1,000 crore. That takes the count to approximately 11.0 billion shares.
At ₹5.75, that implies an equity value of about ₹6,325 crore, against total equity of ₹1,369 crore. So roughly 4.6 times book, and about ₹4,956 crore of the price sits above the net assets.
There is a second anchor, and it is the most uncomfortable number in this note. The August 2025 placement was priced at ₹2.00 a share, and MSE's own general meeting notice records that the price was based on a registered valuer's report which assessed the equity share at ₹2.00. That was eleven months ago. The unlisted market is now 188% above the last independently valued primary round.
Something real happened in between. Turnover is up several hundredfold. The question is whether it is worth 188%.
Here is the forward arithmetic, which we think is the most useful thing in this note. Exchanges are typically valued on earnings. Take MSE's FY26 cost base of ₹84.91 crore, credit it with roughly ₹55 crore of treasury income, tax at 25%, and ask what turnover is required to justify ₹6,325 crore at various multiples, using NSE's cash rate of ₹594 per crore.
At 40 times earnings, MSE needs about ₹16,218 crore of turnover a day. At 30 times, about ₹20,950 crore. At 25 times, about ₹24,736 crore.
For scale, NSE's cash market runs somewhere around ₹1.9 lakh crore a day. So today's price implies MSE eventually captures something in the region of 8.5% to 13% of Indian cash equity volumes, which is between 33 and 50 times its current turnover.
Its market share today is about 0.26%.
The bull case worth taking seriously
We would rather present the strongest version of the other side than a straw man, and there is a real one.
Everything above models cash equities only. MSE holds licences across equity derivatives, currency derivatives, debt and SME, and derivatives economics are an order of magnitude better than cash. Options carry roughly ₹35 per lakh of premium against ₹2.97 per lakh of cash turnover. An exchange that establishes a genuine derivatives franchise does not need 10% of the cash market to make money. That is how BSE re-rated.
So the honest framing of the bull case is not that ₹500 crore a day of cash turnover justifies ₹6,325 crore. It plainly does not. It is that the cash market build is the entry ticket: a functioning order book, real member connectivity, 140 liquid scrips and demonstrated technology are the preconditions a regulator would want to see before permitting a wider derivatives push. On this reading the money being spent is customer acquisition, and the option being priced is derivatives.
That is a coherent thesis. It is also unproven, dependent on regulatory permission that has not been granted, and exposed to the fact that SEBI's May 2025 expiry-day framework has already once removed the differentiation MSE was counting on.
There is also a balance sheet argument. ₹1,369 crore of equity, largely in financial assets, funds a long runway. At the FY26 loss rate, capital is not the binding constraint. Time is not either. What is uncertain is whether time and capital convert into a franchise.
The risks worth naming
The 30 September cliff - LES-II expires on 30 September 2026, and the exchange reserves the right to amend or discontinue it on fifteen days' notice. What happens to volumes in October is the single most informative event available to anyone holding this stock.
Volume that Stops When Payment Stops - The June to July step change tells you the tape responds to incentives. It does not yet tell you that anything responds to the absence of them.
The Operating Revenue Line - Four consecutive years of decline in revenue from operations, in a rising market, is the fact the turnaround has to reverse.
Regulatory Dependence - The derivatives bull case requires permissions MSE does not hold today, from a regulator that has already reshaped the competitive landscape once in a way that hurt this exchange.
Downside to Book - Book value is approximately ₹1.24 a share. If the revival stalls and the market marks the equity toward net assets, that is roughly 78% below the current level. This is the number a buyer should be able to sit with before taking a position.
The Desk View
Metropolitan Stock Exchange (MSEI) is clearing at ₹5.75 on our desk as at 23 July 2026. Current levels and transaction details are on our MSEI unlisted shares page.
Our read : This is not a fraud and it is not a shell. The exchange is functioning, well capitalised, professionally led and executing a deliberate and legitimate strategy to buy its way to critical mass. The volume is genuinely on the tape. The technology works. Those are real accomplishments after a decade of dormancy and we would not dismiss them.
But at ₹5.75 the market is paying about ₹6,325 crore for ₹1,369 crore of net assets plus an option, and the option is carrying roughly ₹4,950 crore of the price. On the cash equity business alone the price requires MSE to become a top-three exchange with something like a tenth of the market. On the derivatives case, which we think is the better argument, the price requires a regulatory approval that does not yet exist.
We would not underwrite ₹6,325 crore against 0.26% market share and a rented order book. We are not short the story either, and we would look at this differently on evidence rather than on narrative.
The specific things that would change our view, in order of importance: volumes holding at or near current levels after 30 September without a further incentive scheme; a credible move toward equity derivatives with regulatory clearance; and revenue from operations reversing four years of decline in the September half-year numbers. Any one of those is worth more than another quarter of paid turnover.
We will update this note when the September numbers arrive and when the scheme's status after 30 September is known.
FAQs
What is the MSEI unlisted share price today?
MSEI is clearing at ₹5.75 a share on the Priveq desk as at 23 July 2026, implying an equity value of about ₹6,325 crore on approximately 11.0 billion shares. Current levels are on our MSEI unlisted shares page. Indicative levels move with the market and are not an offer to deal.
Why did MSE's trading volumes jump in July 2026?
A second Liquidity Enhancement Scheme took effect on 1 July 2026 under circular MSE/BD/19161/2026. Turnover rose 41% on the first day of the scheme and the July average is 185% above June.
Are MSE's volumes real?
The trades are real and appear in the exchange's published trade data. The question is what is driving them. Designated market makers under the scheme are paid incentives and have their transaction charges waived, so a substantial part of the turnover is generated by paid participants rather than by external demand.
How much does the scheme cost MSE?
On our estimate, roughly ₹52 crore to ₹58 crore a year at current volumes. This is an estimate derived from the published incentive schedule, not a disclosed figure.
Is MSE profitable?
No. It reported a net loss of ₹25.84 crore in FY26, narrowed from ₹34.22 crore in FY25. The improvement came mainly from interest income on its capital rather than from exchange operations. Revenue from operations was ₹3.38 crore.
What was MSE's last funding round priced at?
₹2.00 a share in August 2025, when the exchange allotted 500 crore shares at ₹1 face value plus ₹1 premium, raising ₹1,000 crore. The company's general meeting notice records that the price was supported by a registered valuer's report.
When does the current liquidity scheme end?
LES-II runs until 30 September 2026. The exchange reserves the right to amend or discontinue it with fifteen days' notice.
What market share does MSE have?
Approximately 0.26% of Indian cash equity turnover at July 2026 volumes, measured against NSE's daily cash market.
What We Can and Cannot Stand Behind
We think it matters to tell you where each number here comes from.
Verified from primary sources - The share count of 6,000,217,033 as at 31 March 2025, the ₹1 face value, the 1,190,000,000 share private placement during FY25, FY25 turnover of ₹4.32 crore and net worth of ₹396.76 crore all come from the annual return filed with the Registrar of Companies. The FY24 figures, including revenue from operations of ₹7.36 crore, other income of ₹13.68 crore, total expenses of ₹68.64 crore and the loss of ₹48.75 crore, come from the audited financial statements filed with the Registrar. Every turnover figure in this note comes from MSE's own published trade summary data for 1 April 2025 to 22 July 2026. All scheme terms, incentives, obligations and dates come from MSE circular MSE/BD/19161/2026 dated 8 June 2026. The ₹2.00 issue price and the registered valuer's assessment come from the exchange's own general meeting notice.
Our own estimates, labelled as such - The incentive cost of ₹52 crore to ₹58 crore is modelled from the published schedule against observed volumes, and the circular's wording admits more than one reading. The forward turnover requirements are our scenarios using NSE's published cash rate, and they rest on assumptions about cost base, treasury income and multiple that other analysts could reasonably set differently. The implied market cap uses a share count that is verified to March 2025 and then adds the August 2025 allotment, so the current total is derived rather than read from a single filing.
Reported but not primary-verified - The FY26 figures, including revenue from operations of ₹3.38 crore, other income of ₹55.69 crore, total expenses of ₹84.91 crore, the loss of ₹25.84 crore and total equity of ₹1,369.29 crore, come from company disclosures relayed through secondary sources. We would verify these against the audited FY26 statement before treating any single figure as final.
What we could not confirm - The exact number of designated market makers appointed under LES-II, the identities of those market makers, and whether any scheme will follow the 30 September expiry. We have left these as open rather than filling them.
If any of this firms up or changes, we will update the note.
To ask where MSEI is clearing on our desk today, or to work an order, reach us on WhatsApp at +91 82878 66698 or write to support@priveq.in.
Disclaimer: This note is prepared by Priveq Investech Private Limited for information and educational purposes only. It is not investment, financial, legal or tax advice, nor a recommendation or an offer to buy or sell any security. Figures are drawn from filings made by Metropolitan Stock Exchange of India Limited with the Registrar of Companies, the exchange's own published circulars, general meeting notices and trade summary data, publicly available regulatory and market information, and company disclosures relayed through secondary sources. Valuation scenarios, the incentive cost estimate, the implied share count and the forward turnover requirements set out in this note are estimates and judgements of the Priveq research desk. They are not disclosures by the company, its advisers or any regulator, and other analysts working from the same information may reasonably reach materially different conclusions. Indicative unlisted prices, including any Priveq desk level, are not a quote or an offer, are dealer marks in an illiquid market, and may differ materially from any level at which a transaction is concluded or at which the shares may eventually list. Priveq Investech Private Limited transacts as a counterparty in the unlisted shares referenced in this note and therefore holds a commercial interest in them. Certain figures in this note are unaudited or sourced from secondary references and should be independently verified before any investment decision. Investing in unlisted and pre-IPO shares carries substantial risk, including illiquidity, valuation uncertainty, regulatory risk, dependence on regulatory approvals that may not be granted, the risk that a turnaround does not succeed, and the possibility that a listing is delayed or does not occur. The company referenced in this note is loss making and its shares may be worth materially less than the price paid. Past performance does not indicate future results. Conduct your own due diligence and consult a SEBI-registered adviser before investing.