


The Short Version
MtandT Rentals Limited, a Chennai-based access equipment rental and sales company, reported audited standalone FY26 revenue of Rs 358.69 crore and profit after tax of Rs 52.65 crore, with its two CCPS series making up 14.6% of its fully diluted share count as of 28 Oct 2026. MtandT Rentals' Series A and Series B1 preference shares convert on profit-linked formulas, not one for one, so the final equity count and each CCPS holder's effective price per share depend on earnings figures that are not all published yet.
On the registered valuers' formulas, Series B1 converts one for one only at about Rs 46.3 crore of adjusted profit, and FY26 standalone profit without asset-sale gains is about Rs 41 crore, so B1 could convert at more than one share each; even so, the fully diluted count stays within about 3 percent of the one-for-one figure across Rs 40 to 70 crore of adjusted profit. The desk price of Rs 545 (as of 28 Oct 2026) is 18.5 times FY26 profit, against an effective entry near 10 times for both CCPS series, and at the listed peer median of about 14.6 times it needs about Rs 67 crore of annual profit, 27% above FY26. The variable that would change this read is the adjusted profit to 30 Jun 2026, which is not yet published.
Company Data Block
Company: MtandT Rentals Limited (MtandT Rentals)
Sector: Access equipment (aerial work platform) rental and trading; one reportable segment under AS-17
Registered city: Chennai, Tamil Nadu; 1,230 employees at 31 Mar 2026 (annual report FY26)
Latest audited year: FY26, year ended 31 Mar 2026, audited by M S K C & Associates LLP
Key figures (standalone FY26): revenue Rs 358.69 crore; profit after tax Rs 52.65 crore; net worth Rs 325.23 crore (includes CCPS); borrowings Rs 318.98 crore
Desk price: Rs 545 per equity share as of 28 Oct 2026 (indicative); minimum lot 100 shares as shown on the Priveq Marketplace page
Valuation lens: P/E on a profit-linked fully diluted count, EV/EBITDA excluding other income, and the effective entry multiple of each CCPS series (all derived by Priveq)
Securities (NSDL securities search, 28 Oct 2026): equity INE0BC201010; Series A CCPS INE0BC203016 and INE0BC203024; Series B1 CCPS INE0BC203032
CIN: U29253TN2009PLC073258, as printed on the company's filings with MCA
Primary sources: FY26 annual report; Forms PAS-3, MGT-7 and AOC-4 filed with MCA; registered valuer reports attached to the PAS-3 filings; MCA charge register; NSDL securities search
Last verified: 28 Oct 2026
For the live desk snapshot, see MtandT Rentals Limited on Priveq Marketplace.
How The Business Actually Works
MtandT Rentals earned Rs 358.69 crore of revenue in FY26 from two engines of almost equal size, renting access equipment (Rs 169.07 crore, 47.1%) and selling equipment and related products (Rs 189.62 crore, 52.9%), according to Note 15 of its audited standalone accounts. The company buys aerial work platforms and related access products, rents them to customers, and also sells equipment, spares and Porta Deck and Porta Mat products. It had 1,230 employees at year end and reports a single segment, "Rental and Trading of Aerial Work Platform", so the filings give no profit by activity.
The cycle runs in six steps:
Buy the fleet. Cost of materials consumed was Rs 136.73 crore, 38.1% of revenue (derived), and capital expenditure including work in progress was Rs 235.09 crore. One MCA charge in favour of Kotak Mahindra Bank, created on 15 Sep 2026, lists boom lifts, scissor lifts and a tower crane as the secured equipment, which shows the kind of machine behind the fleet.
Fund it with borrowings and preference capital. Borrowings reached Rs 318.98 crore across 13 lenders on 60-month terms at 8 to 10%, secured on the equipment, with promoter personal guarantees and collateral from sister concerns disclosed in Note 5.
Rent it out. The rental gross block rose to Rs 580.66 crore from Rs 374.01 crore. Rental income of Rs 169.07 crore on an average block of about Rs 477 crore is a 35.4% yield and a payback of about 2.8 years (derived). Rental rates, utilisation and fleet unit counts are not disclosed in the audited accounts.
Sell used and new equipment. Equipment sales were Rs 163.69 crore, and profit on sale of assets, booked in other income, was Rs 15.19 crore, which is how part of the fleet rotates.
Collect. Trade receivables were Rs 185.68 crore, which is 189 days of revenue against 153 a year earlier (derived), while payable days were 165 (derived). Receivable days exceed payable days by 24, and that gap is funded by banks and equity.
Repeat with more fleet. Operating cash flow was Rs 52.48 crore against capex of Rs 235.09 crore, and the difference was met by Rs 119.90 crore of CCPS proceeds, Rs 111.79 crore of new long-term borrowing and Rs 33.13 crore from selling property, plant and equipment.
MtandT Rentals' group structure is short. It held 75% of Vertikal Rentals Private Limited at 31 Mar 2026, cut to 26% on 2 Apr 2026 when Vertikal issued fresh shares, so FY27 consolidated numbers will not be like for like. It also has related-party dealings with MtandT Limited, a separate company, covered in the funding section below.
The business breaks in two places: receivables that stretch further than payables, and funding that stops keeping pace with fleet growth. Customer concentration, rental pricing and the effect of input prices on equipment cost were not read in the filings and are not estimated here.
Product And Revenue Segmentation
MtandT Rentals reported product sales of Rs 189.62 crore and rental income of Rs 169.07 crore in FY26, with revenue from operations up 65% to Rs 358.69 crore from Rs 217.35 crore, per Note 15 of the audited standalone accounts. The product and rental lines are:
Equipment sales (Rs 163.69 crore): the audited note does not split them by model or type.
Porta Deck and Porta Mat (Rs 21.68 crore, up from Rs 0.05 crore): sold as a product line, and Porta Deck mats also sit in the rental block at Rs 64.24 crore; the accounts do not describe the product further.
Spares and other products (Rs 3.68 crore): reported as one line.
MAPS (Rs 0.57 crore, down from Rs 2.22 crore): the line is named only as "MAPS sale" in the notes, and aluminium MAPS units also appear in the fixed-asset note.
Rental income (Rs 169.07 crore, up from Rs 118.78 crore): the rental fleet is access vehicles of Rs 508.50 crore gross block, mats of Rs 64.24 crore and web deck of Rs 7.92 crore.
MtandT Rentals: revenue by line, FY26 against FY25
Rs crore, standalone, Note 15 of the FY26 accounts (converted from Rs lakh).
MtandT Rentals: revenue by line, FY26 against FY25. Rs crore, standalone, Note 15 of the FY26 accounts (converted from Rs lakh).
Revenue line | FY26 | FY25 | Share of FY26 revenue |
|---|---|---|---|
Sale of equipment | 163.69 | not read | 45.6% |
Porta Deck and Porta Mat sales | 21.68 | 0.05 | 6.0% |
Spares and other products | 3.68 | not read | 1.0% |
MAPS sales | 0.57 | 2.22 | 0.2% |
Total product sales | 189.62 | not read | 52.9% |
Rental income | 169.07 | 118.78 | 47.1% |
Total revenue from operations | 358.69 | 217.35 | 100.0% |
Source: Note 15, standalone FY26 accounts. FY25 split is shown only where it was read from the comparatives; lines marked not read were not read for FY25. Shares are derived. The company reports one segment ("Rental and Trading of Aerial Work Platform") under AS-17, so there is no segment profit.
Net read: the Porta Deck and Porta Mat line went from almost nothing to Rs 21.68 crore in a year, which explains part of why product sales grew faster than rentals, and it is the one line where the FY26 jump is a new business and not a bigger fleet. The accounts show no segment margin, so the mix effect on profit cannot be sized.
What The FY26 Audited Accounts Show
MtandT Rentals' audited standalone profit after tax rose 70.2% to Rs 52.65 crore in FY26 from Rs 30.94 crore, on revenue up 65.0%, according to its annual report for the year ended 31 Mar 2026. Three features of the profit line matter more than the headline:
The core business grew in its own right. EBITDA excluding other income rose 51.7% to Rs 130.08 crore (derived), with the margin at 36.3% against 39.5% (derived).
Other income is large. Other income of Rs 24.40 crore is 35.3% of profit before tax, and Rs 15.19 crore of it is profit on sale of assets. This is the line the B1 conversion definition caps and excludes, which is why it matters for the share count.
Costs below EBITDA are rising fast. Finance costs rose 53% to Rs 24.39 crore and depreciation rose 55% to Rs 61.05 crore, so a fleet that grew 55% is carrying its cost into every later year.
MtandT Rentals Limited: audited standalone snapshot, FY26 against FY25. Rs crore (converted from Rs lakh in the filing; 1 crore = 10 million). Standalone, audited by M S K C & Associates LLP.
Line | FY26 | FY25 | Tag |
|---|---|---|---|
Revenue from operations | 358.69 | 217.35 | Disclosed |
Other income | 24.40 | 10.94 | Disclosed |
EBITDA excluding other income | 130.08 | 85.77 | Derived |
EBITDA margin excluding other income | 36.3% | 39.5% | Derived |
Finance costs | 24.39 | 15.99 | Disclosed |
Depreciation and amortisation | 61.05 | 39.31 | Disclosed |
Profit before tax | 69.04 | 41.42 | Disclosed |
Profit after tax | 52.65 | 30.94 | Disclosed |
Other income as a share of profit before tax | 35.3% | 26.4% | Derived |
Net worth (includes CCPS) | 325.23 | 156.07 | Disclosed |
Borrowings (long term plus short term) | 318.98 | 196.55 | Disclosed |
Operating cash flow | 52.48 | 19.76 | Disclosed |
Capital expenditure (including work in progress and creditors) | 235.09 | 132.93 | Disclosed |
Trade receivables, net | 185.68 | 91.03 | Disclosed |
Receivable days (year-end receivables / revenue x 365) | 189 | 153 | Derived |
Inventory days | 56 | 71 | Derived |
Payable days | 165 | 148 | Derived |
Cash conversion cycle (days) | 80 | 76 | Derived |
Source: standalone statement of profit and loss, balance sheet and cash flow, MtandT Rentals annual report FY26 (net worth, borrowings, receivables and capex as shown in the notes; FY25 as comparatives in the FY26 accounts). EBITDA, margins, days and shares are derived by Priveq from those lines. EBITDA excludes other income and is profit before tax less other income plus finance costs plus depreciation. FY25 comparatives in the FY26 accounts differ from the FY25 AOC-4 XBRL on at least two lines (other income, trade receivables); the FY26 comparatives are used here.
Net read: MtandT Rentals grew profit faster than revenue in FY26, and the gap between profit and cash flow is the receivables line. Stripping the asset-sale gains takes standalone profit to about Rs 41 crore on an average-tax basis (derived), still above FY25's Rs 30.94 crore, so the underlying growth is there but the headline is flattered by about Rs 11.6 crore (derived).
Corporate History And Capital Structure
MtandT Rentals has raised about Rs 181.95 crore through five share allotments since December 2024, according to Form PAS-3 filings with MCA and the FY26 annual report (derived sum of the cash raised in each allotment). The company was incorporated in 2009 per its CIN, and its equity count was 1,52,62,796 at 31 Mar 2026 after 10 equity shares issued on 21 Mar 2026 under the preference-share terms.
The price ladder has three steps:
Rs 238 equity rounds (24 Dec 2024 and 17 Feb 2025): 26,07,230 shares raised Rs 62.05 crore, on a registered valuer's DCF fair value of Rs 238 per share (report of 9 Oct 2024).
Rs 459 Series A CCPS (2 Sep and 11 Dec 2025): 4,33,550 shares raised Rs 19.90 crore, within 37 paise of the valuer's Rs 458.63 fair value at 30 Jun 2025 (report of 4 Jul 2025).
Rs 459 Series B1 CCPS (21 Mar 2026): 21,78,639 shares raised Rs 99.99 crore, while the registered valuer's fair value at 31 Dec 2025 was Rs 303.35 (report of 20 Feb 2026), so the issue price was 51% above it (derived).
MtandT Rentals: price ladder of shares issued since December 2024
Rs per share and Rs crore; face value Rs 10; issue price includes face value.
Date | Instrument | Shares | Price (Rs) | Cash raised (Rs Cr) | Registered valuer basis |
|---|---|---|---|---|---|
24 Dec 2024 | Equity | 21,05,043 | 238 | 50.10 | Rs 238 per share, DCF, report 9 Oct 2024 |
17 Feb 2025 | Equity | 5,02,187 | 238 | 11.95 | Same report |
2 Sep 2025 | Series A CCPS | 1,78,649 | 459 | 8.20 | Rs 458.63 per share at 30 Jun 2025, report 4 Jul 2025 |
11 Dec 2025 | Series A CCPS | 2,54,901 | 459 | 11.70 | Same report |
21 Mar 2026 | Series B1 CCPS | 21,78,639 | 459 | 100.00 | Rs 303.35 per share at 31 Dec 2025, report 20 Feb 2026 |
21 Mar 2026 | Equity (issued under the B1 terms) | 10 | 459 | 0.00046 (Rs 4,590) | Not read |
Source: Form PAS-3 filings with MCA (allotments of 24 Dec 2024, 17 Feb 2025, 2 Sep 2025, 11 Dec 2025 and 21 Mar 2026) and their attached registered valuer reports; FY26 annual report note on private placements. Cash raised is derived (shares x price). Series A plus Series B1 cash is Rs 19.90 crore plus Rs 99.99 crore, which equals the aggregate consideration of Rs 1,19,89,94,751 stated in the directors' report to the rupee; the directors' report lists the two Series A tranches and the 10 equity shares but does not list the B1 line. The B1 issue price is 51.3% above the valuer's fair value (derived); the PAS-3 attributes the price to commercial negotiation.
The share base matters, so it helps to keep four counts apart. Equity is 1,52,62,796 shares. Series A is 4,33,550. Series B1 is 21,78,639. Counted one for one, the three add to 1,78,74,985, the same figure the company uses for its own fully diluted promoter table and the same count the Marketplace panel uses. At the Rs 459 issue price that count equals about Rs 820 crore, which is the figure the B1 round implies only if every CCPS converts one for one; for B1 that needs adjusted profit of exactly Rs 46.3 crore (derived).
Ownership splits two ways because of the CCPS:
Equity-only: promoters hold 81.04% of the 1,52,62,796 equity shares (derived from the annual report's promoter disclosure), against 81.27% in the FY25 MGT-7.
Fully diluted, one for one: promoters hold 69.20% of 1,78,74,985 shares, the company's own note i basis.
CCPS holders above 5% of their series (institutions named, others not): Invicta Continuum Fund I (63,181 Series A) and Ninedot Ventures LLP (50,109 Series A); ValueQuest Scale Fund II (7,62,517 Series B1, 35% of the series). A three-member family group holds 14,16,122 Series B1 shares (65%), and four corporates and one individual hold 21,786 Series A each.
Net read: the Rs 459 price is a placeholder, not a valuation. The registered valuer put B1 at Rs 303.35, and the formula that follows decides what each CCPS holder finally pays per equity share, which is the subject of the next section.
How The CCPS Convert
MtandT Rentals has two CCPS series, Series A (4,33,550 shares, Rs 19.90 crore) and Series B1 (21,78,639 shares, Rs 99.99 crore), and the audited FY26 notes state that both convert compulsorily into equity on terms fixed after a Financial Metric Finalization Date, which the registered valuers' reports describe as a profit measure, so the Rs 459 issue price is a starting point and not a final price. The two series differ in everything except that, and the side-by-side below is the one table that settles which terms belong to which.
MtandT Rentals CCPS: Series A and Series B1 terms side by side
Terms as stated in the audited FY26 notes, Form PAS-3 filings, registered valuer reports and the NSDL securities search. The shareholders' agreement and its Schedule 9 are not public.
Term | Series A CCPS | Series B1 CCPS |
|---|---|---|
NSDL ISIN | INE0BC203016 (2 Sep 2025 tranche); INE0BC203024 (11 Dec 2025 tranche) | INE0BC203032 |
Equity ISIN (for reference) | INE0BC201010 | INE0BC201010 |
Shares and issue price | 4,33,550 at Rs 459 | 21,78,639 at Rs 459 |
Dividend | 0.001% a year in the PAS-3 filings and the NSDL descriptions; 0.01% cumulative (or as-if-converted if higher) in the audited FY26 note. Unreconciled. | 0.01% cumulative, or the as-if-converted equity dividend if higher (audited FY26 note; NSDL description) |
Voting | None (audited FY26 note) | Votes as if converted, with a promoter proxy backstop (audited FY26 note) |
Maturity | 18 months per the valuer; NSDL descriptions show 2 Mar 2027 and 11 Jun 2027 | 20 years from allotment (NSDL: 21 Mar 2046); holder may convert earlier |
Conversion formula in the valuer report | Rs 700 crore / (10 x audited FY26 profit after tax), report of 4 Jul 2025 | Rs 463 crore / (10 x adjusted audited profit, trailing twelve months to 30 Jun 2026), report of 20 Feb 2026 |
Conversion terms in the audited FY26 note | Converts within 5 business days after the Financial Metric Finalization Date; ratio per Schedule 9 of the transaction documents | Converts at the issue price until that date, then at the Adjusted Series B1 Conversion Price; anti-dilution per the agreement |
Valuer fair value per share | Rs 458.63 | Rs 303.35 |
Holders above 5% of the series (institutions named) | Invicta Continuum Fund I 63,181; Ninedot Ventures LLP 50,109; five other holders of 21,786 each (four corporates, one individual) | ValueQuest Scale Fund II 7,62,517 (35%); a three-member family group 14,16,122 (65%) |
Source: audited standalone notes to accounts, FY26 annual report (terms of CCPS issued 2 Sep and 11 Dec 2025; terms of Series B1 CCPS; holders above 5%); Form PAS-3 filed with MCA for the Sep and Dec 2025 and 21 Mar 2026 allotments; registered valuer reports dated 4 Jul 2025 and 20 Feb 2026; NSDL securities company search, 28 Oct 2026. The mapping of each Series A ISIN to its tranche is inferred from the date in the NSDL description. Individuals and family groups are not named.
Series B1. The registered valuer's report of 20 Feb 2026 describes the conversion ratio as Rs 463 crore divided by ten times adjusted audited profit for the twelve months to 30 Jun 2026. Adjusted profit leaves out discontinued operations, caps other income at 26% of profit before tax, and excludes one-off items and asset-sale gains and their tax. The shareholders' agreement of 12 Mar 2026 governs and is not public, so this is the valuer's account of the formula and not the contract. The B1 holder converts at the Rs 459 issue price until the Financial Metric Finalization Date and at an adjusted price after it, and can convert at any time before the 20-year outer date.
Applying that definition to FY26 standalone numbers, as an illustration only:
Other income capped at 26% of profit before tax: adjusted profit of about Rs 47.7 crore on the simple cap, or Rs 46.0 crore if the cap applies to profit after the excess is removed.
Asset-sale gains of Rs 15.19 crore also excluded: adjusted profit of about Rs 41.1 crore at the FY26 average tax rate of 23.7%.
The one-for-one line: Rs 46.3 crore, the valuer's own projection of the trailing profit.
The agreement's trailing period (to 30 Jun 2026) differs from FY26, and the first quarter of FY27 is unpublished, so the true figure sits somewhere within or around that band. The point stands whichever way it lands: the B1 ratio is not far from one, and which side of one it lands depends on how adjusted profit is defined.
Series A. The registered valuer's report of 4 Jul 2025 describes a ratio of Rs 700 crore divided by ten times audited FY26 profit. On audited standalone FY26 profit of Rs 52.65 crore that is 1.3295 equity shares per CCPS, or 576,390 shares for the whole series, an effective price of about Rs 345 against the Rs 459 issue price (all derived). Two complications keep this from being a settled number. The audited FY26 note says Series A converts within five business days after the Financial Metric Finalization Date and refers to Schedule 9 of the transaction documents, which is the Series B1 finalisation schedule, so the Series A ratio may now run on the later agreement and not the July 2025 formula. And the dividend rate differs by source: the PAS-3 filings and the NSDL descriptions say 0.001%, the audited note says 0.01% cumulative. We carry both as unresolved.
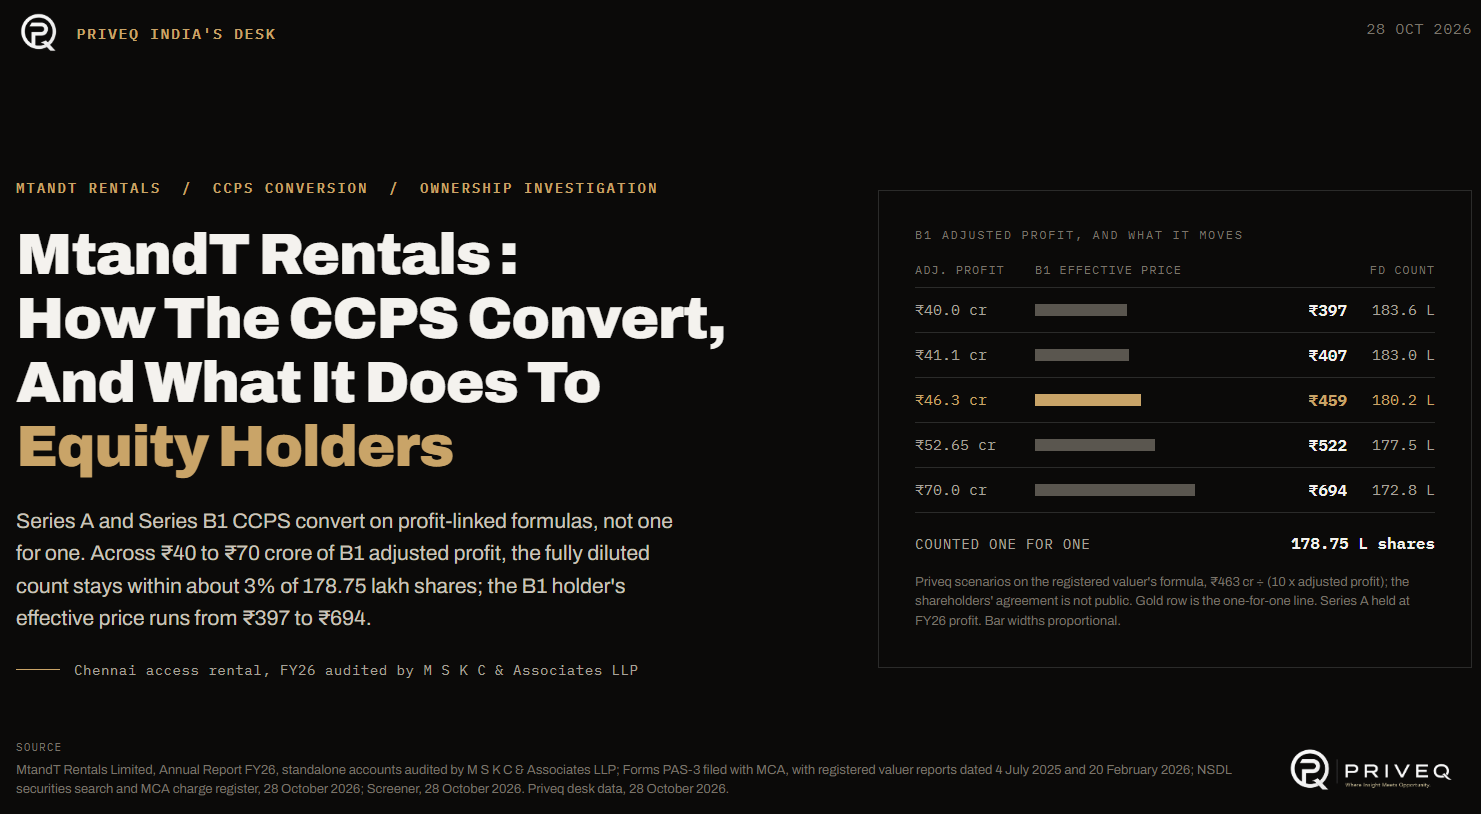
MtandT Rentals: what Series B1 adjusted profit does to the share count
Priveq desk scenarios, not company guidance. Share counts in lakh; Rs per share; adjusted profit in Rs crore.
B1 adjusted profit | Basis | B1 ratio | B1 shares on conversion | B1 effective price (Rs) | Fully diluted shares (lakh) | Against 1:1 count | P/E at desk price |
|---|---|---|---|---|---|---|---|
40.0 | Scenario | 1.157 | 25,21,775 | 397 | 183.61 | +2.7% | 19.0x |
41.1 | Derived: FY26 standalone profit excluding asset-sale gains | 1.127 | 24,56,206 | 407 | 182.95 | +2.4% | 18.9x |
46.3 | Valuer's projection (one for one line) | 1.000 | 21,78,639 | 459 | 180.18 | +0.8% | 18.6x |
47.7 | Derived: FY26 standalone, other income capped at 26% of PBT only | 0.970 | 21,13,083 | 473 | 179.52 | +0.4% | 18.6x |
52.65 | FY26 reported standalone PAT (not the agreement basis) | 0.879 | 19,15,780 | 522 | 177.55 | -0.7% | 18.4x |
60.0 | Scenario | 0.772 | 16,81,183 | 595 | 175.20 | -2.0% | 18.1x |
70.0 | Scenario | 0.661 | 14,41,014 | 694 | 172.80 | -3.3% | 17.9x |
Arithmetic: B1 ratio = 463 / (10 x adjusted profit); B1 shares = 21,78,639 x ratio; effective price = Rs 459 / ratio. Series A is held at the FY26 audited profit of Rs 52.65 crore on the valuer's July 2025 formula (ratio 1.3295, 5,76,390 shares, effective price about Rs 345); equity is 1,52,62,796 shares. The 1:1 count is 1,78,74,985. P/E is the desk price of Rs 545 (as of 28 Oct 2026) times the fully diluted shares, divided by FY26 standalone profit of Rs 52.65 crore. Adjusted profit is defined in the shareholders' agreement, which is not public; the 46.3 line is the valuer's projection, the 41.1 and 47.7 lines are Priveq illustrations on FY26 standalone numbers at the FY26 average tax rate of 23.7%, and the agreement's trailing period (twelve months to 30 Jun 2026) differs from FY26. Holder-level rounding is ignored.
The share count barely moves. Across Rs 40 to 70 crore of B1 adjusted profit, the fully diluted count ranges from 183.6 to 172.8 lakh shares, within about 3 percent of the 1:1 count of 178.75 lakh. What moves a lot is the effective price each B1 CCPS holder pays per equity share, from about Rs 397 at Rs 40 crore to about Rs 694 at Rs 70 crore. Equity holders carry modest dilution risk, and the CCPS holders carry the price risk.
The base cases, each on Series A held at its FY26 formula:
Lower profit (B1 adjusted profit of Rs 40 crore): B1 converts at 1.157 shares each, the fully diluted count is 183.6 lakh, equity-only holders own 83.1% and promoters 67.4% of the converted base.
FY26 without asset-sale gains (about Rs 41 crore): B1 converts at 1.127, the count is 183.0 lakh, equity-only holders own 83.4% and promoters 67.6%.
The valuer's line (Rs 46.3 crore): B1 converts one for one, the count is 180.2 lakh, equity-only holders own 84.7% and promoters 68.6%.
FY26 reported profit (Rs 52.65 crore, not the agreement basis): B1 converts at 0.879, the count is 177.5 lakh, equity-only holders own 86.0% and promoters 69.7%.
Higher profit (Rs 70 crore): B1 converts at 0.661, the count is 172.8 lakh, equity-only holders own 88.3% and promoters 71.6%.
Why the formulas matter for price. Both formulas are built on ten times profit. A holder who converts at the formula ends up with equity priced at about ten times the relevant profit, whatever the Rs 459 headline said. That is well below what the desk price implies for the equity, and the next table sets the three side by side.
MtandT Rentals: what each class effectively pays for FY26 profit
Multiples of profit; pre-money equity value divided by profit. Derived by Priveq from valuer formulas and the desk price.
Class | Headline (at the Rs 459 issue price; desk price Rs 545 as of 28 Oct 2026) | Effective after the conversion formula | Basis |
|---|---|---|---|
Series A CCPS | Rs 701 crore pre-money, 13.3x FY26 profit | 10.0x FY26 profit (Rs 527 crore pre-money, about Rs 345 a share) | Valuer formula of 4 Jul 2025; may be superseded by Schedule 9 |
Series B1 CCPS | Rs 701 crore pre-money, 15.1x the valuer's Rs 46.3 crore projection | 10.0x adjusted trailing profit to 30 Jun 2026 by construction | Valuer formula of 20 Feb 2026 |
Equity at the desk price | Rs 974 crore on the 1:1 count, 18.5x FY26 profit | Not applicable | Desk price Rs 545 as of 28 Oct 2026; 1,78,74,985 shares |
Source: derived from the registered valuer reports of 4 Jul 2025 and 20 Feb 2026 (formulas), Form PAS-3 filings (issue price Rs 459), the FY26 audited profit of Rs 52.65 crore and the Priveq desk price. If the agreements differ from the valuers' descriptions, the effective column changes. Desk prices are indicative.
CCPS against equity: what each holder carries.
Entry price. CCPS holders effectively enter at about 10 times profit under the valuer formulas; equity at the desk price sits at 18.5 times FY26 profit (as of 28 Oct 2026).
Protection. If profit falls short, the conversion ratio rises and the CCPS holder receives more shares; the cost is borne by equity holders through dilution, which the grid shows is a few percent.
Dividends. The audited note says no dividend may be paid on equity unless the CCPS holders give prior written consent, and CCPS dividends are at the higher of 0.01% a year and the as-if-converted equity rate (audited note; Series A is 0.001% in the PAS-3 filings).
Liquidation. Equity holders receive what remains after preferential dues, and the liquidation preference sits in the shareholders' agreement (clause 12), which is not public.
Voting. Series A has no vote; Series B1 votes as if converted, with a promoter proxy backstop, so voting weight and economic weight differ.
Anti-dilution. Series B1 carries anti-dilution protection under clause 8 of the agreement, which is not public.
Pricing in practice. The Rs 545 desk price (as of 28 Oct 2026) relates to equity shares only; no CCPS price is quoted here. For reference, ten times FY26 profit per fully diluted share is about Rs 295 (derived), and the registered valuer's B1 fair value was Rs 303.35 at 31 Dec 2025.
Net read: the CCPS are not a cheaper way to own the same earnings at an identical risk. They are a different instrument with a lower effective entry, preferential rights and a ratio that moves against the equity when profit disappoints. The desk equity price does not carry those protections, and the gap between about 10 times and 18.5 times is the premium the desk price carries over the CCPS entry, as of 28 Oct 2026.
What The Desk Price Assumes
MtandT Rentals' desk price of Rs 545 (as of 28 Oct 2026) equals 18.5 times FY26 standalone profit on the one-for-one share count, against 14.3 times for Sanghvi Movers and 14.8 times for Crown Lifters, the two listed Indian equipment-rental names read on 26 to 28 Oct 2026.
Neither peer is a like-for-like comparison, and the table says so. Sanghvi Movers is the only mainboard-listed Indian crane-rental company, and Crown Lifters is a small NSE SME crane renter with a market cap of about Rs 122 crore and a thin float, so it is shown and not anchored on. Cranes and access platforms are different machines sold to overlapping customers. United Rentals is a large US equipment renter and sits in the table as a reference band only. Herc Holdings is left out because its trailing P/E of about 87 times reflects a net margin near 1%, which is an artefact of the denominator and not a valuation.
MtandT Rentals against listed equipment-rental peers
Trailing multiples; as-of dates differ by row and are shown. Secondary source (Screener for the two Indian peers, StockAnalysis for United Rentals); not audited figures.
Company | As of | Price | Trailing P/E | EV/EBITDA | P/B | Note |
|---|---|---|---|---|---|---|
MtandT Rentals (desk, standalone FY26) | 28 Oct 2026 | Rs 545 | 18.5x (derived) | 9.4x (derived) | 3.0x (derived) | Unlisted; 1:1 share count; EBITDA excludes other income |
Sanghvi Movers (BSE) | 28 Oct 2026 close | Rs 348 | 14.6x | 8.4x (derived) | 2.3x (derived) | Crane rental; mainboard; consolidated; EV/EBITDA on trailing operating profit of Rs 426 crore |
Crown Lifters (NSE) | 28 Oct 2026, 9:44 AM IST | Rs 106 | 13.7x | not read | not read | Crane rental; market cap about Rs 123 crore; thin float, shown not anchored on |
United Rentals (NYSE) | 26 Oct 2026 | not read | 24.7x (forward 18.9x) | 16.9x | 7.2x | US equipment rental; reference band only |
Median of the two Indian peers | 14.2x | Sanghvi Movers and Crown Lifters |
Source: peer data from Screener (Indian peers, read 28 Oct 2026) and StockAnalysis (United Rentals, as of 26 Oct 2026), secondary; Sanghvi Movers EV/EBITDA derived as market cap of Rs 2,997 crore plus borrowings of Rs 674 crore less investments of Rs 87 crore, over trailing operating profit of Rs 426 crore, and P/B as price over book value of Rs 151; MtandT row derived from FY26 audited standalone figures. MtandT EV is market cap of Rs 974 crore plus net debt of Rs 249 crore (borrowings Rs 318.98 crore less cash and bank Rs 45.45 crore and liquid current investments Rs 25.00 crore, at 31 Mar 2026); EV/EBITDA uses EBITDA excluding other income (Rs 130 crore); on EBITDA including other income it is 7.9x. P/B uses standalone net worth of Rs 325.23 crore, which includes CCPS. Herc Holdings is left out of the table because its trailing P/E of about 87x reflects a net margin near 1%, not valuation. Refresh before each distribution push.
The identity P/E = P/B divided by ROE holds on MtandT's own numbers: 3.00 times book on a closing return on net worth of 16.2% gives 18.5 times earnings (derived). On a closing-book basis the return is above Sanghvi Movers' 15.0%, and the premium is 27% on P/E over the peer median, and 19% on EV/EBITDA and 37% on price to book over Sanghvi Movers, the only peer with those two figures read (derived; bases noted in the table).
The next table turns the multiple into a profit requirement.
MtandT Rentals: the profit the desk price needs at each multiple
Rs crore of annual profit after tax needed for the desk price of Rs 545 (as of 28 Oct 2026) to sit at the stated trailing multiple, on 1,78,74,985 shares. Priveq arithmetic, not guidance.
Multiple applied | P/E | Profit needed (Rs Cr) | Against FY26 profit of Rs 52.65 Cr |
|---|---|---|---|
Listed crane-rental peer, lower (Crown Lifters, trailing) | 13.7x | 71.1 | +35% |
Listed crane-rental peer, higher (Sanghvi Movers, trailing) | 14.6x | 66.7 | +27% |
Median of the two peers | 14.2x | 68.8 | +31% |
Desk price on FY26 profit (derived) | 18.5x | 52.7 | +0% |
Median less 10% unlisted discount (illustrative) | 12.7x | 76.5 | +45% |
Median less 20% unlisted discount (illustrative) | 11.3x | 86.1 | +63% |
Median less 30% unlisted discount (illustrative) | 9.9x | 98.4 | +87% |
Arithmetic: profit needed = desk price / P/E x 1,78,74,985 shares. The unlisted-discount rows apply a discount to the peer median and are illustrations; no registered valuer discount was read. The share count is held at the 1:1 count and conversion dilution is not modelled in this table. No company guidance for FY27 profit exists in the annual report; the chairman's statement states a target of annual growth above 25% over a decade.
At the peer median of about 14.2 times, the desk price needs about Rs 69 crore of annual profit, 31% above FY26. The annual report gives no FY27 profit guidance, but the chairman's statement states an ambition of annual growth above 25% over the next decade, and a 25% rise on FY26 profit lands at about Rs 66 crore. The desk price therefore pays for a little over a year of the company's stated ambition at peer multiples, and for roughly 1.7 to 2.8 years of it if the unlisted-discount rows are the right yardstick (derived scenarios, not forecasts).
Net read: the desk price is a growth premium over listed crane rental, not a discount to FY26 earnings, and its fairness turns on how fast profit compounds from here and on how much of FY26's profit came from asset sales.
Market Size, Demand And Growth
India's aerial work platform rental market grew 18% in 2025 and its rental fleet grew 14%, according to Ducker Carlisle's figures for IPAF as reported by Vertikal on 1 Jul 2026. That is a third-party estimate, and it sits beside a very different sizing: IMARC puts the India aerial work platform market at USD 944.1 million in 2025 rising to USD 1,513.0 million by 2034, a 5.11% compound growth rate (updated 23 Jul 2026, one publisher).
India access equipment rental: market and company reference points
Mixed currencies and bases; each row is separate and none is blended. Third-party figures are attributed estimates.
Metric | Figure | Source and date | Tier |
|---|---|---|---|
India aerial work platform rental market growth, 2025 | +18% market; fleet +14% | Ducker Carlisle for IPAF, reported by Vertikal, 1 Jul 2026 | Third-party estimate |
India aerial work platform market size | USD 944.1 million (2025) to USD 1,513.0 million (2034), 5.11% CAGR | IMARC Group, updated 23 Jul 2026 (single publisher) | Third-party estimate |
India operating MEWP fleet and structure | About 14,000 units; 5-8 organised and 100-200 unorganised renters | Access International, 14 Feb 2024 | Third-party estimate |
MtandT rental revenue growth, FY26 | 42.3% (Rs 169.07 crore against Rs 118.78 crore) | FY26 audited accounts, Note 15; growth derived | Disclosed, derived |
MtandT rental fleet gross block growth, FY26 | 55.3% (Rs 580.66 crore against Rs 374.01 crore) | FY26 audited fixed-asset note; growth derived | Disclosed, derived |
MtandT company-stated ambition | Annual growth above 25% over the next decade | Chairman's statement, FY26 annual report | Company-stated |
MtandT share of the market | Not computed | No fleet unit count was read in the audited accounts and the market figures are in dollars on different bases | Not read |
Market figures are third-party estimates with opaque methods; the two sizing sources differ widely in growth (18% in one year against a 5.1% nine-year CAGR) and are shown, not reconciled. TAM, SAM and SOM were dropped because no bottom-up fleet or utilisation input exists in the filings; growth, fleet and market-structure metrics are used instead.
The two sources are not reconciled and are not blended. One reports a single strong year, the other a nine-year average, and they use different definitions and currencies. Both agree the market is growing; neither gives a basis for a company share.
Structure matters more than size here. Access International's count of 14 Feb 2024 put India's operating fleet at about 14,000 machines with 5 to 8 organised renters and 100 to 200 unorganised ones, and quoted a forecast of 40,000 to 50,000 units within five years from a rental company chief executive. A fragmented market with few organised renters tends to reward the renter with access to capital; MtandT Rentals raised Rs 119.90 crore of CCPS capital in FY26 and spent Rs 235.09 crore on capital expenditure.
MtandT Rentals grew faster than the market in FY26: rental revenue rose 42.3% against the market's 18%, and its rental gross block rose 55.3% against a 14% fleet growth in the market. The filings support new fleet as the driver, funded by Rs 235.09 crore of capex, and not an acquisition, because Vertikal was consolidated in both years. Whether that is share gain or a higher-priced mix cannot be told from the accounts, since fleet units and rates are not disclosed.
Which metrics were used and why: TAM, SAM and SOM were dropped because no fleet-count, utilisation or rate input exists in the primary filings, and the third-party market figures are in dollars on different bases. Growth, fleet and market-structure metrics are used instead, each labelled by source.
What Moves Growth And Margins
MtandT Rentals' profit is most exposed to three things, the other income inside it, the receivables behind it and the borrowing cost on its fleet, according to its FY26 audited accounts and notes. The scorecard sets out every driver that could be sized from the filings.
MtandT Rentals: growth and margin drivers
Direction is the effect on profit or the equity count; evidence from the FY26 audited accounts unless stated.
Driver | Direction | How it shows in the numbers | Tier |
|---|---|---|---|
Rental fleet yield and utilisation | Either | Rental revenue Rs 169.07 crore on an average gross rental block of about Rs 477 crore, a 35.4% yield and a payback of about 2.8 years (derived) | Disclosed, derived |
Equipment sales mix | Either | Product sales Rs 189.62 crore, with Porta Deck and Porta Mat at Rs 21.68 crore against Rs 0.05 crore a year earlier | Disclosed |
Other income and asset-sale gains | Either | Other income Rs 24.40 crore is 35.3% of profit before tax, of which profit on sale of assets is Rs 15.19 crore; this feeds the B1 adjusted-profit definition | Disclosed, derived |
Receivable days | Down | 189 days against 153; receivables Rs 185.68 crore against Rs 91.03 crore; bad debts written off Rs 5.89 crore; Rs 5.71 crore doubtful provision | Disclosed, derived |
Funding cost and debt load | Down | Finance costs up 53% to Rs 24.39 crore; borrowings Rs 318.98 crore at 8 to 10% across 13 lenders; promoter guarantees and collateral | Disclosed |
Depreciation load | Down | Depreciation up 55% to Rs 61.05 crore as the fleet grows | Disclosed |
CCPS conversion | Down for equity holders if adjusted profit falls | Fully diluted count moves from 172.8 to 183.6 lakh across Rs 70 to 40 crore of B1 adjusted profit | Scenario |
Related-party dealings | Either | Related-party sales about 6.8% of revenue and related-party receivables about 9.3% of receivables (derived) | Disclosed, derived |
Vertikal Rentals deconsolidation | Either | Stake cut from 75% to 26% on 2 Apr 2026; FY27 consolidated growth will not be like for like | Disclosed |
Families checked and not sized: input commodity prices (no hedging or pass-through note was read), currency (import dependence not read) and regulation (no company-specific mandate or licence dependence was read in the accounts).
The grid below sizes the two drivers that can be put through the numbers, a change in rental revenue and a rise in borrowing cost.
MtandT Rentals: standalone profit after tax against rental revenue and borrowing cost
Rs crore of profit after tax (change against FY26 profit of Rs 52.65 crore). Priveq scenarios, not forecasts.
Rental revenue change | Borrowing cost unchanged | +100 bps on borrowings | +200 bps on borrowings |
|---|---|---|---|
-10% | 39.8 (-24%) | 37.3 (-29%) | 34.9 (-34%) |
-5% | 46.2 (-12%) | 43.8 (-17%) | 41.3 (-21%) |
+0% | 52.7 (+0%) | 50.2 (-5%) | 47.8 (-9%) |
+5% | 59.1 (+12%) | 56.7 (+8%) | 54.2 (+3%) |
+10% | 65.5 (+24%) | 63.1 (+20%) | 60.7 (+15%) |
Arithmetic: profit after tax = (FY26 profit before tax of Rs 69.04 crore + rental revenue change x Rs 169.07 crore - borrowings of Rs 318.98 crore x rate change) x (1 - 23.7% FY26 effective tax rate). Rental revenue changes are assumed to flow through at 100% because segment margins are not disclosed; this overstates the effect of a volume fall and fits a rate change better. A 100 bps rise on closing borrowings costs about Rs 2.4 crore of profit (4.6%). Other lines are held constant.
A 5% change in rental revenue moves standalone profit by about Rs 6.4 crore, or 12%, at full flow-through; a 100 basis point rise in borrowing cost costs about Rs 2.4 crore, or 4.6%. Neither moves profit as much as the Rs 11.6 crore of asset-sale gains (derived) already inside FY26's Rs 52.65 crore, and that line also decides the B1 conversion definition.
Net read: other income quality and receivable days dominate the range of outcomes. A year in which asset-sale gains do not repeat lowers reported profit by roughly a fifth without touching the underlying rental business, and a further stretch in receivable days from 189 would absorb cash that the fleet plan already uses.
Funding, Charges And Related Parties
MtandT Rentals had Rs 318.98 crore of borrowings at 31 Mar 2026, and MCA charge filings show Rs 85.24 crore of further charges created between 1 Apr and 28 Oct 2026, according to the audited balance sheet and the charge register read on 28 Oct 2026.
MtandT Rentals: borrowings, registered charges and related-party balances
Rs crore. Charge amounts are the amounts secured in MCA charge filings, not drawn debt.
Item | Figure | Source and basis |
|---|---|---|
Borrowings at 31 Mar 2026 | ||
Long-term borrowings | 176.36 | Standalone balance sheet, FY26 |
Short-term borrowings | 142.62 | Standalone balance sheet, FY26 |
Total borrowings; debt to net worth | 318.98; 0.98x | Disclosed; ratio derived |
Charges registered with MCA, as read on 28 Oct 2026 | ||
Charge creation events (131 events since 2015) | 508.21 | MCA charge filings; ledger, not outstanding |
Of which created in FY26 (20 events) | 161.34 | MCA charge filings |
Of which created 1 Apr to 28 Oct 2026 (9 events) | 85.24 | MCA charge filings |
Modifications (4 events); satisfactions (30 events) | 143.04; 72.21 | MCA charge filings |
Largest lenders by amount across all events | HDFC Bank 234.74; Axis Bank 173.03; Yes Bank 47.12; Kotak Mahindra Bank 45.30; Standard Chartered Bank 43.70; ICICI Bank 42.06 | MCA charge filings |
Related-party balances with MtandT Limited, FY26 | ||
Royalty deposit; security deposit | 26.00; 2.04 | Notes on related parties |
Long-term trade receivable | 23.125 | Notes on related parties |
Related-party sales; current related-party receivables | about 24.3 (6.8% of revenue); about 17.35 (9.3% of receivables) | Notes on related parties; shares derived |
Corporate guarantees given for Vertikal Rentals | about 17.45 | Notes on contingent liabilities |
Charge amounts include modifications and limits and cannot be compared with drawn borrowings; they are shown to evidence continued fleet funding, including Rs 85.24 crore of new charges after year-end. A few charge entries carry no filing date or property type in the register. Related-party items are stated as disclosed, with no claim about intent. One related-party disclosure (MAPS sales to a related party of Rs 8.25 crore) does not reconcile to the MAPS line of Rs 0.57 crore in Note 15 and is carried as an open item.
The facts as disclosed are these:
Borrowings (Note 5): 13 lenders on 60-month terms at 8 to 10%, secured primarily on hypothecated equipment; collateral from properties of sister concerns and promoters; personal guarantees of promoter-directors; and credit under the government-backed GECL and ECLGS schemes.
Charges: 131 creations, 4 modifications and 30 satisfactions in the register; the amounts are secured limits and cannot be added up as debt.
AGM of 31 Oct 2026: the notice proposes a borrowing limit under section 180(1)(c) of up to Rs 1,000 crore above paid-up capital, free reserves and securities premium, and approvals under section 185 for loans and guarantees.
Vertikal Rentals: an outstanding loan of Rs 142.50 lakh and guarantees of about Rs 17.45 crore to its lenders, with the company becoming an associate on 2 Apr 2026.
MtandT Limited (a separate company): a royalty deposit of Rs 26.00 crore, a security deposit of Rs 2.04 crore and a long-term trade receivable of Rs 23.125 crore, with related-party sales of about Rs 24.3 crore (about 6.8% of revenue) and current related-party receivables of about Rs 17.35 crore (about 9.3% of receivables); the balances are as disclosed in the notes on related parties and the shares of revenue and receivables are derived.
Open items the filings leave, as reconciliation questions for the company and not findings:
MAPS sales. The related-party note shows MAPS sales of Rs 8.25 crore, while Note 15 shows MAPS sales of Rs 0.57 crore in total.
Board report against audited profit and loss. The board report's table shows consolidated profit of Rs 5,267.73 lakh and EPS of 33.93 basic and 33.40 diluted; the audited consolidated statement shows Rs 5,264.23 lakh and 34.49 and 33.95. The standalone figures agree.
FY25 comparatives. The FY25 comparatives in the FY26 accounts differ from the FY25 AOC-4 XBRL on at least two lines, other income (Rs 10.94 crore against Rs 9.94 crore) and trade receivables (Rs 91.03 crore against Rs 108.57 crore).
Private placement list. The directors' report lists the two Series A tranches and the 10 equity shares but not the B1 allotment, yet its stated total of Rs 1,19,89,94,751 equals Series A plus Series B1 to the rupee.
These items do not change the audit opinion or the conversion math. They are the ones we would ask the company to explain, and a later filing may settle them.
The Desk View
MtandT Rentals' desk price of Rs 545 (as of 28 Oct 2026) reflects unlisted market-driven activity and is not an independent Priveq valuation call. Four points drive our read:
The desk price is a growth premium over listed crane rental. At 18.5 times FY26 profit against 14.3 to 14.8 times for two listed peers, the price needs about Rs 67 crore of profit at the peer median, 27% above FY26, and more if an unlisted discount applies.
The CCPS holders carry the price risk and the equity holders carry the smaller dilution risk. Both formulas settle near ten times profit, so CCPS holders effectively entered at roughly half the desk multiple, and the fully diluted count stays within about 3 percent of the one-for-one figure across a wide range of B1 adjusted profit.
Earnings quality decides the B1 ratio and the base for the multiple. Other income is 35% of FY26 profit before tax, Rs 15.19 crore of it from asset sales, and standalone profit without those gains is about Rs 41 crore, under the Rs 46.3 crore line where B1 converts one for one.
Growth is funded faster than it is collected. Capex of Rs 235.09 crore ran against operating cash flow of Rs 52.48 crore, receivable days stretched to 189 from 153, and finance costs rose 53%, so the growth case depends on borrowing staying available and receivables turning into cash.
Stated position: on FY26 profit and a listed peer median of about 14.6 times, the equity points to about Rs 429 a share before any unlisted discount, against the desk price of Rs 545 (as of 28 Oct 2026), with a swing of about Rs 81 a share for every Rs 10 crore of annual profit at that multiple (derived arithmetic, not a target price). The one variable that would change the read most is the adjusted profit to 30 Jun 2026, because it sets the B1 ratio, tests how much of the profit is recurring, and will show whether FY27 profit is on a path to the Rs 67 crore the desk price needs.
What This Means, By Situation
If you already hold this position. Your economic exposure is to the equity count after conversion and to the profit that supports Rs 545 (as of 28 Oct 2026). The fully diluted count stays within about 3 percent of the one-for-one figure across the scenarios, so the larger exposure is the profit path, the asset-sale gains inside FY26 and receivable days. Whether your shares are equity or CCPS decides which table applies to you.
If you are evaluating a first position. The questions to carry into the conversation are which instrument is on offer, what effective price it implies under the conversion formulas, and how the quoted price relates to the roughly 10 times profit at which the CCPS convert. The Rs 545 desk price (as of 28 Oct 2026) relates to equity shares only. Priveq is not SEBI-registered to give investment advice, and this piece does not recommend a purchase or sale.
If you are advising a client on this. The documents worth requesting are the shareholders' agreement terms on adjusted profit and Schedule 9 of the transaction documents, which are not public, and the company's statement of the Financial Metric Finalization Date. Ask which profit measure, standalone or consolidated, the formulas use.
What to watch, with dates:
31 Oct 2026: the 17th AGM, which adopts the FY26 accounts, appoints M S K C & Associates LLP as auditors for five years, regularises an independent director and votes on the borrowing limit.
After the AGM: the FY26 AOC-4 filing with MCA, due within the statutory period after the meeting.
Not yet dated: the Financial Metric Finalization Date and the adjusted profit for the twelve months to 30 Jun 2026.
2 Mar 2027 and 11 Jun 2027: the maturity dates in the NSDL descriptions of the two Series A CCPS, which indicate the outer limits for their conversion.
FY27 results: the first year without Vertikal consolidated.
FAQs
How do MtandT Rentals CCPS convert into equity shares?
MtandT Rentals CCPS convert compulsorily at ratios tied to profit, not one for one, so the final equity count depends on audited earnings. The company has two series. Series A (4,33,550 shares) converts after the Financial Metric Finalization Date, and the registered valuer described a ratio of Rs 700 crore divided by ten times audited FY26 profit. Series B1 (21,78,639 shares) converts at Rs 463 crore divided by ten times adjusted profit for the twelve months to 30 Jun 2026, per the valuer's report of 20 Feb 2026. The shareholders' agreement governs and is not public.
What is the MtandT Rentals unlisted share price today?
The Priveq desk quotes MtandT Rentals equity at Rs 545 per share as of 28 Oct 2026, an indicative price that moves. Desk prices reflect unlisted market activity, are subject to change without notice and should be confirmed with the desk before any transaction. The price is for equity shares, not CCPS.
Are MtandT Rentals' FY26 numbers audited and filed?
FY26 accounts are audited and published, but the FY26 AOC-4 had not been filed with MCA as of 28 Oct 2026. The audited standalone and consolidated statements are in the annual report for the 17th AGM of 31 Oct 2026, and the latest AOC-4 filed with MCA covers FY25, filed on 31 Jan 2026.
What is still unconfirmed about MtandT Rentals' CCPS?
-Several terms rest on valuer reports and an agreement that is not public, so the final conversion ratios remain unconfirmed. The open items are:
the adjusted profit to 30 Jun 2026 and the Financial Metric Finalization Date
whether the formulas use standalone or consolidated profit
whether the Series A ratio follows the July 2025 valuer formula or Schedule 9 of the later agreement
the Series A dividend rate, which is 0.001% in the PAS-3 filings and 0.01% in the audited note
the liquidation preference and anti-dilution terms in the shareholders' agreement
What is the difference between Series A and Series B1 CCPS?
Series A has no vote and a July 2025 valuer formula on FY26 profit; B1 votes as if converted and uses adjusted trailing profit. Both were issued at Rs 459. Series A raised Rs 19.90 crore in two tranches (2 Sep and 11 Dec 2025) and Series B1 raised Rs 99.99 crore on 21 Mar 2026. Each has its own NSDL ISIN.
Should equity holders worry that the CCPS will dilute their stake a lot?
On the valuers' formulas, dilution stays within about 3 percent of the one-for-one count across a wide profit range. Across Rs 40 to 70 crore of B1 adjusted profit, the fully diluted count runs from 183.6 to 172.8 lakh shares against 178.75 lakh counted one for one. What moves far more is the effective price each CCPS holder pays per share.
How does the MtandT Rentals price compare with listed peers?
At Rs 545 (28 Oct 2026) the desk price is about 18.5 times FY26 profit, against 13.7 to 14.6 times for two listed peers. The peers are Sanghvi Movers and Crown Lifters, both crane renters, so the comparison is adjacent and not like for like. At the peer median the desk price needs about Rs 69 crore of annual profit.
How do I buy MtandT Rentals unlisted shares and what is the minimum lot?
Request a quote on the Priveq Marketplace page or WhatsApp the desk; the page shows a minimum lot of 100 shares. See MtandT Rentals Limited on Priveq Marketplace for the live desk snapshot and documents.
How does MtandT Rentals make money?
MtandT Rentals earns from renting access equipment and from selling equipment and related products, at 47.1% and 52.9% of FY26 revenue. Rental income was Rs 169.07 crore and product sales Rs 189.62 crore, per Note 15 of the audited standalone accounts. Rentals grew 42% and the rental fleet's gross block grew 55%.
What We Can And Cannot Stand Behind
Primary-sourced and verified
MtandT Rentals' FY26 standalone revenue of Rs 358.69 crore, profit before tax of Rs 69.04 crore and profit after tax of Rs 52.65 crore (annual report FY26, standalone statement of profit and loss).
The revenue split of Rs 189.62 crore product sales and Rs 169.07 crore rental income (Note 15).
The allotments of 4,33,550 Series A CCPS and 21,78,639 Series B1 CCPS at Rs 459, and the equity rounds at Rs 238 (Form PAS-3 filings with MCA; annual report note on private placements).
The four NSDL ISINs and their descriptions (NSDL securities search, 28 Oct 2026).
Borrowings of Rs 318.98 crore and the charge register counts and amounts (balance sheet; MCA charge filings read 28 Oct 2026).
The terms of each CCPS series as stated in the audited FY26 notes (terms of CCPS issued 2 Sep and 11 Dec 2025; terms of Series B1 CCPS).
Indicative or derived
The conversion ratios, effective prices, fully diluted counts and effective multiples: derived from valuer descriptions of formulas in the agreement, which is not public; scenarios, not contract terms.
The adjusted-profit illustrations of Rs 47.7 crore, Rs 46.0 crore and Rs 41.1 crore: Priveq arithmetic on FY26 standalone numbers at the FY26 average tax rate, which differs from the agreement's trailing period and definitions.
EBITDA, margins, receivable, inventory and payable days, EV/EBITDA, P/B and ROE: derived from audited lines.
The profit the desk price needs at each multiple, and the sensitivity grid: scenarios, not guidance.
Peer multiples: secondary-source figures read 26 to 28 Oct 2026 on different pull dates (Indian peers on 28 Oct); they move daily and should be refreshed before use.
Market figures: single-publisher third-party estimates with undisclosed methods.
Could not confirm
The shareholders' agreement, its Schedule 9 and the Financial Metric Finalization Date, and therefore the operative conversion formulas. The agreement is referred to in the audited FY26 notes and the valuer reports but is not among the MCA filings, the annual report or the NSDL record read on 28 Oct 2026, so the formulas used here are the registered valuers' descriptions, not the contract.
The adjusted profit to 30 Jun 2026 and whether the formulas use standalone or consolidated profit. The company is unlisted and publishes no quarterly results, and neither the 4 Jul 2025 nor the 20 Feb 2026 valuer report says which basis applies.
The Series A dividend rate. The board resolution of 11 Dec 2025, the PAS-3 filings and NSDL give a non-cumulative dividend of up to 0.001%; the audited FY26 note gives a cumulative 0.01%, which is also the rate in the 20 Feb 2026 Series B1 valuer report. The company's own documents conflict, and only the shareholders' agreement settles it. Whether the Series A ratio follows the July 2025 valuer formula is likewise unconfirmed.
The reasons for the board report's consolidated profit table differing from the audited statement, the FY25 comparative differences, the MAPS related-party line against Note 15, and the private placement list in the directors' report.
Rental rates, utilisation, fleet unit counts, customer concentration and input-price pass-through: not disclosed in the annual report or in the group CEO's interview of 1 Sep 2026, which gives no fleet count or utilisation figure.
Later filings for the ValueQuest Scale Fund II investment, such as the FY26 annual return: not yet filed or not yet visible, so shareholding after 31 Mar 2026 rests on the annual report.
Primary Sources
Company documents
MtandT Rentals annual report FY26: standalone and consolidated statements; Note 5 (borrowings); Note 15 (revenue); notes on related parties; terms of CCPS issued 2 Sep and 11 Dec 2025 and of Series B1 CCPS; directors' report on private placements; AGM notice for 31 Oct 2026.
Registry filings (MCA)
Form PAS-3, allotment of 24 Dec 2024 (filed 26 Dec 2024), with registered valuer report of 9 Oct 2024.
Form PAS-3, allotment of 17 Feb 2025.
Form PAS-3, allotments of 2 Sep 2025 and 11 Dec 2025, with registered valuer report of 4 Jul 2025.
Form PAS-3, allotment of 21 Mar 2026 (filed 23 Mar 2026), with registered valuer report of 20 Feb 2026.
Form MGT-7 and Form AOC-4 for FY25, both filed 31 Jan 2026.
MCA charge register, read 28 Oct 2026.
Where Priveq hosts a filing, it is on the Documents tab of the Marketplace page.
Depository
NSDL securities company search, searched 28 Oct 2026 for "MtandT".
Secondary sources (peers and market size)
Screener, Sanghvi Movers (consolidated) and Screener, Crown Lifters, read 28 Oct 2026; StockAnalysis, United Rentals statistics, as of 26 Oct 2026.
Ducker Carlisle for IPAF, as reported by Vertikal, 1 Jul 2026.
IMARC Group, India aerial work platform market, updated 23 Jul 2026.
Access International, India MEWP fleet article, 14 Feb 2024.
Indian Infrastructure, interview with the MtandT Rentals group CEO, 1 Sep 2026.
Talk to the desk: WhatsApp +91 82874 66698 | support@priveq.in | View MtandT Rentals on the Priveq Marketplace
Disclaimer: This piece reflects Priveq India's (Priveq Investech Private Limited, Priveq.in) own research, based on primary filings, regulatory disclosures, and the company's own audited financial statements as detailed above. It is not investment advice, and does not allege any wrongdoing, misstatement, or violation by MtandT Rentals Limited; the conversion terms, reconciliation questions and other findings noted in this piece are read directly from the company's own public disclosures and MCA filings. Priveq Investech Private Limited is not registered with the Securities and Exchange Board of India (SEBI) as a stock broker, investment adviser, or research analyst. This piece is independent desk research and commentary, not "research" as defined under the SEBI (Research Analysts) Regulations, 2014, and should not be construed as investment advice from a SEBI-registered entity. Priveq transacts as a named counterparty in the unlisted shares discussed here, including MtandT Rentals Limited, and may hold or deal in these shares before, during, or after publication; our commercial interest and the views in this piece sit in the same place, and should be weighed accordingly. Desk prices are indicative, subject to change without notice, and should be confirmed directly with the desk before any transaction. Unlisted securities are illiquid, carry a high risk of loss, and may be difficult to value or sell; prices move sharply and without notice. Readers should independently verify all figures against the company's own filings and consult qualified financial and legal advisors before transacting. Past performance and price appreciation referenced here are not indicative of future results.